Recorded Performance
Explore this Page
- About Performance Recording
- Configuration
- Viewing Recorded Performance Data
- Viewing Session and Database Information
- Recording Status
About Performance Recording
Recorded Performance is a tool that records the performance data of SAN resources. The data that is collected depends on the counters and instances configured for the recording session. Recorded performance data from the session can be selectively retrieved for viewing in the DataCore Management Console and can also be exported to a CSV file.
Data for each counter is presented in the DataCore Management Console as points in an X-Y graph. For each point on the graph, specific data is provided, such as the data collected, instance and timestamp. The time period displayed in the graph can be adjusted and zoomed in or out while viewing the data. The default recording interval resolution is every two minutes. The resolution displayed on the graph can be adjusted to see data points at longer time intervals.
Recording Server
The recording server can be a DataCore Server in the local server group or a remote server running Microsoft SQL Server®. Remote SQL Servers running SQL Server® (with the exception of Express editions) allows for larger databases and increased system resources. The recording server can be configured in the server group settings or when the recording session is started for the first time.
Local Recording Server Notes
- Local recording servers store performance data using SQL Server Express LocalDB 2012. (Microsoft SQL Server Express edition software is installed with DataCore SANsymphony.
- The SQL Server LocalDB is subject to Microsoft licensing limitations.
- A maximum of 10 GB of data can be stored in the database. When the SQL Server Express database reaches capacity on a DataCore Server, the oldest day of data will be discarded to make space for newer data. As the database nears capacity at proximately 9.5 GB, an alert will be posted as a warning. Data can be exported to a CSV file to keep it permanently. The amount of storage space used for the DcsPerf database can be monitored from the DataCore Management Console.
Memory processing resources are limited in the Express edition. Memory usage will increase as the number of configured counters increases. Viewing recorded information also consumes additional memory resources. Keep the number of configured counters to a moderate amount to avoid time-out issues. Reduce the number of counters if necessary.
Remote SQL Server Requirements and Notes
- Microsoft SQL Server® 2012, and 2014 (Standard, Enterprise, Developer, or Express editions) are supported.
- The SQL Server instance used for recording must be created prior to configuring the remote SQL Server in DataCore SANsymphony .
- Windows authentication or SQL Server login credentials are required for configuration of a remote SQL Server. During SQL Server installation, the default authentication mode is set to Windows authentication. We recommend that "mixed mode" authentication be set, which allows the use of both Windows authentication and SQL Server authentication. The authentication mode can be changed in SQL Server Management Studio under Server Properties>Security. The SQL Server service must be restarted for the change to take effect.
- An SQL Server system administrator (sa) Login account must be created for the SQL Server instance that matches the account and password used to authenticate. This account should be added as an SQL Server administrator and be assigned sufficient privileges which include the ability to create, own, upgrade and modify databases, and create and modify tables. Permission must be granted to connect to the database engine and the login must be enabled.
- The DataCore Executive Service (Dcsx.exe) account in the server group (created during installation) must be able to pass the authentication method selected. For Windows authentication, add the same account and password to Windows Local Users on the SQL Server machine.
- Remote connections must be allowed to the SQL Server instance. In Windows Firewall, use the wizard to create a custom inbound rule for all programs to use the TCP protocol for port 1433 for any IP address (local and remote) and allow the connection for IPsec or not. The appropriate profile should be selected in order to connect to the SQL Server instance. Enable the TCP/IP protocol for the SQL Server instance in SQL Server Configuration Manager. The SQL Server instance service must be restarted for the change to take effect.
- The DataCore Server or console running Performance Recording must be able to resolve the remote server host name to the IP address. Each in the local server group must be able to resolve the host name of the remote SQL Server to which it is connecting. See Name Resolution.
- DataCore SANsymphony does not perform database maintenance on remote servers. The amount of storage space used for the remote SQL Server database and the data recording rate can also be monitored from the DataCore Management Console.
For more information or instructions about configuring Microsoft SQL Server, consult your SQL Server Administrator or the Microsoft SQL Server documentation. For more information about configuring Windows Firewall, consult your IT Administrator or the Windows documentation.
Configuration
In order to record performance data, a recording session must be configured and a recording server has to be assigned to store the performance data. One recording session can be configured and recorded at a time.
Configuring a Recording Session
To configure a recording session, counters must be added to the session. The counters in the recording session can be added or removed on-the-fly while the session is recording.
Counters can be added either individually or "All counters" can be added. If "All counters" are added to the recording session, the "All counters" cannot be edited to remove one or more counters. To change the counters in this case, "All counters" should be removed, then the required individual counters should be added. The same behavior applies when "All instances" are added to the session. See counter category descriptions in the topic Live Performance.
The counters based on Average Time / IO (reads or writes) are calculated based on the total time per second that all IOs took to complete divided by the total number of
Adding Counters
To add counters and configure a recording session:
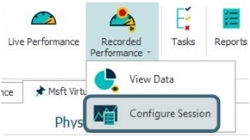
- In the Ribbon>Home tab, under Diagnostics click Recorded Performance and then click Configure Session to open the Recording Session page where the recording session is configured.
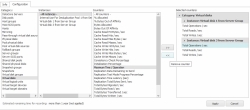
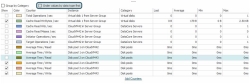
- In the Configuration tab, select a category, then select instances and counters for
that category. Multiple selections can be made for counters and instances or all can be selected. To view counter descriptions, hover the mouse over the counter name in the list.
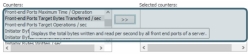
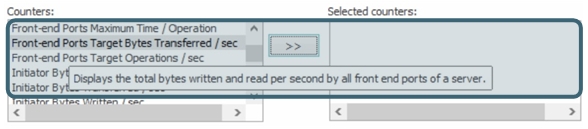
- Click the right-arrow button
 to add the selections to the recording session. The counters and instances will appear in the Selected Counters box to the right. This box displays the configured session.
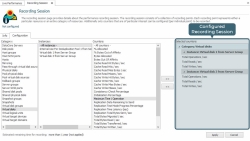
- Repeat steps 2 and 3 as necessary to configure additional counters.
- When finished adding counters, click Apply. The recording session will be saved.


Removing Counters
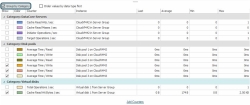
To remove counters or instances from the recording session:
- In the Ribbon>Home tab, under Diagnostics click Recorded Performance and then click Configure Session to open the Recording Session page where the session is configured.
- In the Configuration tab, under the Selected Counters box for the session, select the counters or instances to be removed. Multiple counter selections can be made or entire categories or instances can be selected for removal.
- Click the left-arrow button
 to remove the selections from the recording session.
 - When finished removing counters, click Apply.

Counters have to be removed as they were added. For instance, if "All counters" for a virtual disk were added, individual counters cannot be removed separately.
Starting a Recording Session
In order to start a recording session, the session must be configured and a recording server must be assigned. If a recording server is not assigned, it can be assigned when the session is started. The recording server can be changed at any time in the server group settings.
To assign a recording server and start a recording session:
- In the Ribbon>Home tab, under Diagnostics click Recorded Performance and then click Configure Session to open the Recording Session page where the session is configured.
- In the Ribbon>Recording Session Actions tab, click Start Recording.
- If the recording server has not been assigned, the Configuration tab will open to select the recording server.
- To select a local DataCore Server as the recording server, select Local SQL Server and select the server in the Recording Server pulldown menu.
- To select a remote SQL server, select Remote SQL Server.
- In Remote server, enter the hostname and server instance name of the remote SQL Server. (For example, hostname\SQL Server instance name)
- In Database name, enter the name of the database in which to store the recorded data. If the database does not exist, it will be created on the remote server.
- To use Windows login credentials to authenticate, enable the Use Windows Authentication check box.
The credentials must be configured on the remote SQL Server.
- to use the SQL Server credentials for authentication, clear the Use Windows Authentication check box and enter the Username and Password configured for the SQL Server login.
- Click Test Connection. The status of the connection will be displayed in the box.
During the test, the status will read CONNECTING... A successful connection status is === CONNECTION ESTABLISHED! ===.
or,
If the test completes and the status is CONNECTION FAILED! a message will appear showing the SQL Server error in order to remedy the problem. Check the network connection, firewall rules, and ensure proper name resolution exists. Also check the Info tab in the Recording Session details.
- Click Apply. The session status may temporarily change to Idle as the recording server is being configured. When the recording begins, the session status changes to Recording.
- In the Ribbon>Home tab, under Diagnostics click Recorded Performance and then click Configure Session to open the Recording Session page where the session is configured.
- In the Ribbon>Recording Session Actions tab, click Stop Recording. The performance recording status will change to Idle.
Configuring or Changing the Performance Recording Server
The performance recording server is used to record counters for performance and producing Data Usage Reports used for the Charge Back feature. The recording server can be changed at any time and while performance is being recorded. If configuring a remote SQL Server, see Remote SQL Server Requirements for important information.
Recorded data can only be accessed from the recording server on which it was recorded. When the recording server is changed, the recorded data is not moved to the new recording server. Therefore, in order to view data that was previously recorded on a different server, the recording server will have to be changed to the server that recorded the data.
To configure a recording server:
- Open the Server Group Details page>Settings tab and see the Performance Recording Server Settings area.
- To select a local DataCore Server as the recording server, select Local SQL Server and select the server in the Recording Server pull-down menu.
- To select a remote SQL server, select Remote SQL Server.
- In Remote server, enter the address of the remote SQL Server.
- In Database name, enter the name of the database in which to store the recorded data. If the database does not exist, it will be created on the remote server. If the database exists, it must be empty (without objects, tables, etc.).
- To use Windows login credentials to authenticate, enable the Use Windows Authentication check box.
The credentials must be configured on the remote SQL Server.
or - To use the SQL Server credentials for authentication, clear the Use Windows Authentication check box and enter the Username and Password configured for the SQL Server login.
- Click Test Connection. The status of the connection will be displayed in the box.
During the test, the status will read CONNECTING... A successful connection status is === CONNECTION ESTABLISHED! ===.
If the test completes and the status is CONNECTION FAILED! check the network connection or ensure proper name resolution exists.
- Click Apply.
Viewing Recorded Performance Data
Recorded performance data can be retrieved and viewed in the DataCore Management Console and also exported to a CSV file. In order to view recorded performance, data must be retrieved from the database. To retrieve the data, counters must be added for the instances to display on the graph. The performance data must exist in the database for it to be viewed. Data for instances which no longer exist in the server group, but are stored in the database can also be retrieved.
The performance data displayed in the graph can be zoomed in to see data during a narrow time frame or zoomed out to see data during a broad time frame. The resolution of the data points in the graph can also be increased or decreased. Counters that have been selected for viewing are displayed in a table at the bottom of the graph. A maximum of 50 counters can be added to the counter table.
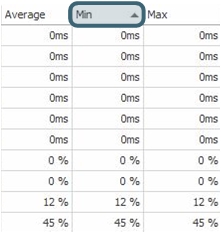
In addition to the counter name, data such as minimum, maximum and average are displayed. This data can be sorted by data type or by number. Since counters are different data types (such as size, count, percent) and the sizes can be different (KB, MB, GB), scaling is done automatically and the values are displayed accordingly.
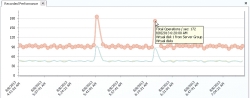
As shown in the screen capture below, tool tips show the user-friendly value and the value in bytes.
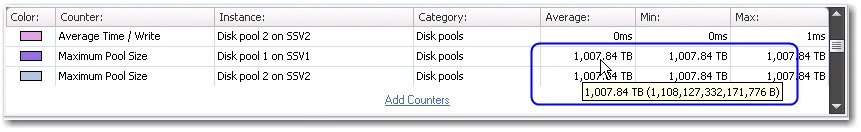
Timestamps in the console are displayed according to the system time zone of the computer running the DataCore Management Console. Data is recorded in UTC (Coordinated Universal Time) in the database.
To add counters to view in the graph:
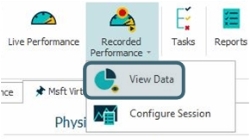
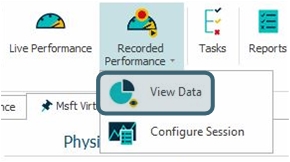
- In the Ribbon>Home tab, under Diagnostics click Recorded Performance and then click View Data.
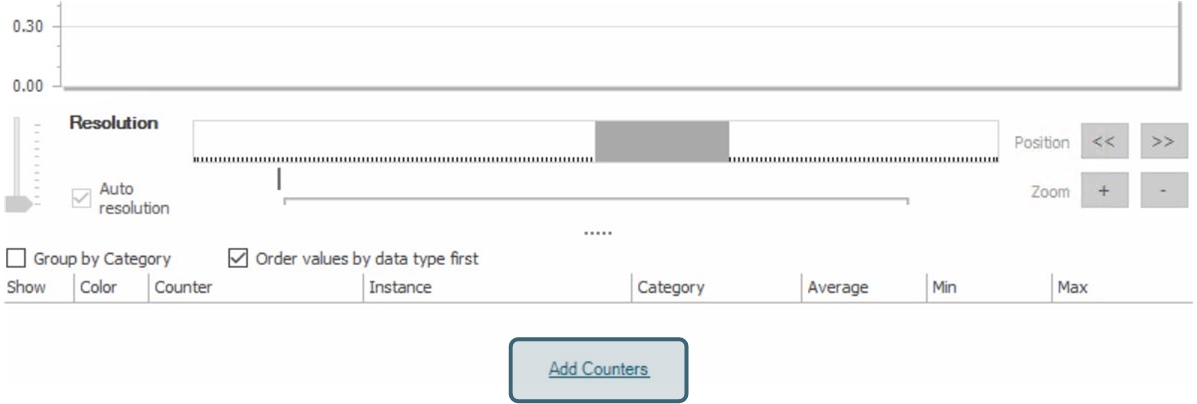
- Click Add Counters to begin selecting the counters to display.
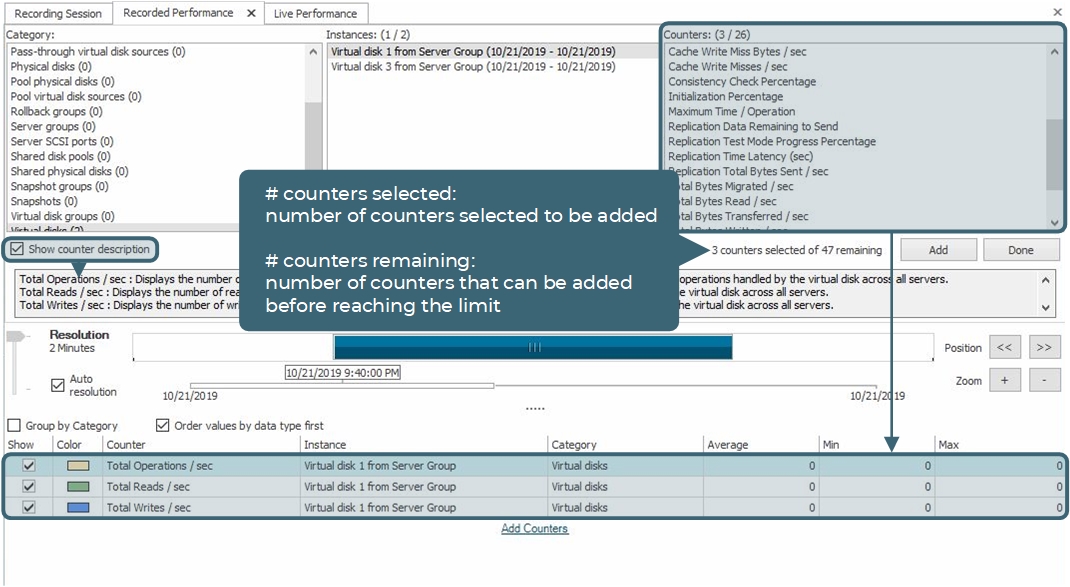
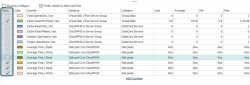
- Select the category, instances and counters to display and click Add. The counter will be added to the table at the bottom of the tab.
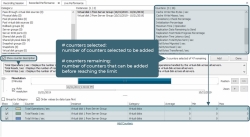
- A complete list of categories and counters are provided from which to choose. A number in parenthesis (1) following the categories indicate the number of instances that exist in the database for that category.
- Instances will be unavailable (greyed out) if data does not exist in the time period displayed in the graph. (See the following section to adjust the time period if necessary.)
- The number of counters that can be added to the graph (# remaining) are provided next to the Add button.
- To display counter descriptions, select the Show counter description check box and then click on a counter in the Counters box above.
- Repeat the last step until all required counters have been added and then click Done. The graph will appear.
- Select a counter in the table under the graph to reveal the data points for that counter in the graph.
- Each x,y point in the graph contains data for the selected counter. Click on a point in the graph to display the data.

To adjust the display of counters in the graph:
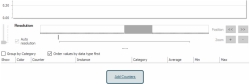
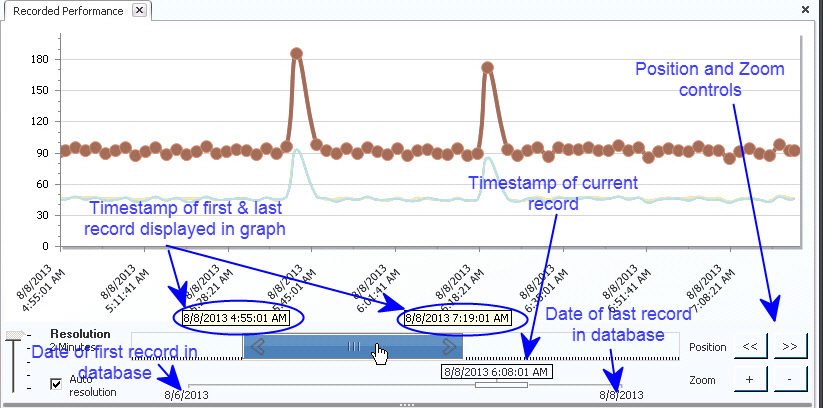
The blue bar in the control under the graph, and the Position and Zoom buttons control the time period that is displayed on the graph.
- A key at the bottom of the control shows the data displayed in the graph in relation to the entire database. The entire database is represented by the line under the control bar. The date of the first and last record in the database is displayed at either end of the line. The data that is displayed in the graph is represented by the narrow rectangle. The current record is indicated by a line and the timestamp is displayed above the rectangle. The blue bar represents the time period displayed in the graph. Timestamps for the beginning and end of the time period represented by the blue bar can be displayed by clicking in the blue bar. As the time period displayed in the graph is changed, the rectangle on the line will move in relation to its location in the database.

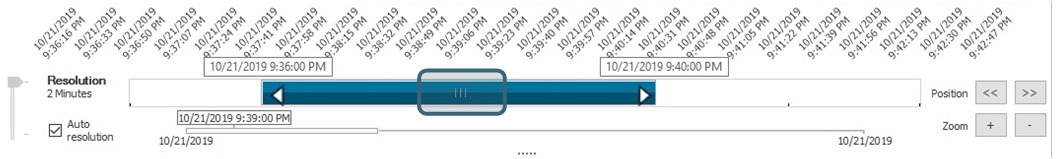
- To shorten the time period displayed in the graph. drag the ends towards the center of the bar to shorten the bar. To lengthen the time period, drag the ends out towards the end of the time control to lengthen the blue bar. Alternatively, the Zoom buttons also shorten (-) or lengthen (+) the displayed time period.
- To move the selected time period into a different time frame, drag the entire blue bar to the left or to the right. To quickly scroll to the beginning or end of the data, drag the arrow at either end of the blue bar and continue dragging. The arrow begins to turn a lighter color as scrolling accelerates. Alternatively, the Position buttons can also be used to scroll through the data.

- To quickly scroll to the beginning or end of the data, zoom in as much as possible to expand the time frame viewed in the graph and then drag the arrow at either end of the blue bar and continue dragging. The arrow begins to turn a lighter color as scrolling accelerates and the hand leaves the frame.
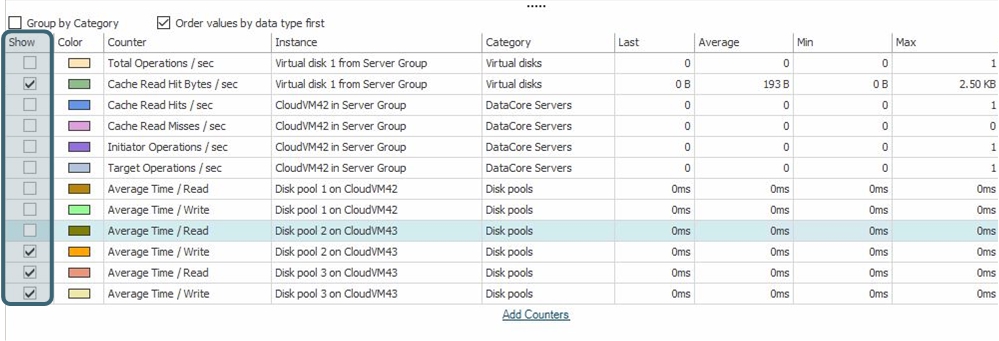
- The check box in the Show column allows or prevents the display of counters in the graph without removing the counters from the counter table. By selecting or clearing the check boxes, a series of counters can be displayed together in the graph.


To change the resolution displayed on the graph:
The resolution of the data can be set manually by using the slide bar or auto resolution can be set. The resolution controls and the current resolution setting are to the left of the time period controls under the graph.
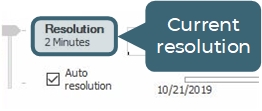
- Select the Auto resolution check box to base the resolution on the time period selected.
- To manually set the resolution, clear the Auto resolution check box and use the slide bar to select a different value. To view data with a finer resolution, select a shorter time period.
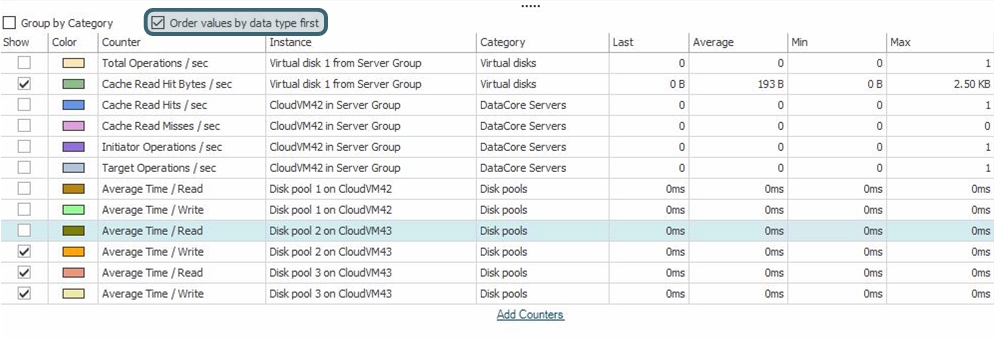
To sort the data in the table under the graph:
By default, the data in the counter table is sorted by type and then by value.
- To sort counters by data type, select the Order values by data type first check box

- To sort the counter table by number, clear the Order values by data type first check box.
- To sort counters by number in a column from either smallest to largest or largest to smallest, click on a column to get an arrow and click again to change the arrow direction.

- To sort counters by category, select the Group by Category check box.


To export the data to a CSV file:
- In View Data, set the resolution to the desired interval of data. The data points that are displayed will be exported to the file.
- While viewing the data to export, in the Ribbon>Recorded Performance Actions tab, click Export to CSV.
- In the Save As dialog box, select the path and enter the file name.
- Click Save. The data is saved and can be viewed in spreadsheet software.
Viewing Session and Database Information
Information for the recording session and database are provided and database space can be monitored in the Recording Session page. Refer to the following table for details.
To view the information:
- In the Ribbon>Home tab, under Diagnostics click Recorded Performance and then click Configure Session to open the Recording Session page where the session is configured.
- Open the Info tab.
| Recording and Database Information | |
|---|---|
|
Recording on |
The server that is currently recording performance data.
|
|
Configured server |
The server that is configured as the recording server. |
|
Database name |
The name of the database where the performance data is stored. If the recording server is a local DataCore Server, the database resides in the DataCore SANsymphony installation folder (default location C:\Program Files\DataCore\SANsymphony). |
|
Recorded period |
Date of the first and last record in the database. |
|
Used storage |
Amount of storage used for the database. |
|
Remaining time |
Estimated time remaining until the local DcsPerf database reaches maximum capacity. This field is only available if a local SQL Server is configured as recording server. |
|
Recording data rate |
The average amount of data that is being recorded per day. This field is only available if a remote SQL Server is configured as recording server. |
Recording Status
Status is displayed under the icon at the top of the Recording Session page.

Possible statuses:
| Recording Status | |
|---|---|
|
Not Configured |
The initial status of the session when the recording server has not yet been configured. |
|
Idle |
The recording session is stopped or not started. |
|
Recording |
The recording session is running. |
|
Recording / Failed |
An error has occurred with the recording database and the recording session has failed. |
Learn More