Live Performance
Explore this Page
- Overview
- Performance Data and Counters
- Opening the Tool
- Viewing Counter Descriptions
- Adding or Removing Counters
- Adding/Removing Counters in a Recording Session
- Interpreting Graph Lines
- Changing the Frequency of Data Updates
- Clearing the Display
- Pausing/Resuming the Tool
Overview
The Live Performance tool provides real-time monitoring of SANsymphony system metrics. It displays performance counters for various components in graphical and numeric formats, helping diagnose bottlenecks and track system activity.
Performance Data and Counters
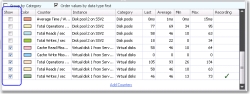
Performance data is acquired through DataCore device drivers and reported through counters numerically and graphically in the tool. Counter data is displayed for last, average, minimum and maximum values. The Show column displays or hides the counters in the graph without removing the counters from the counter table below. The Recording column is checked when a counter is being recorded.
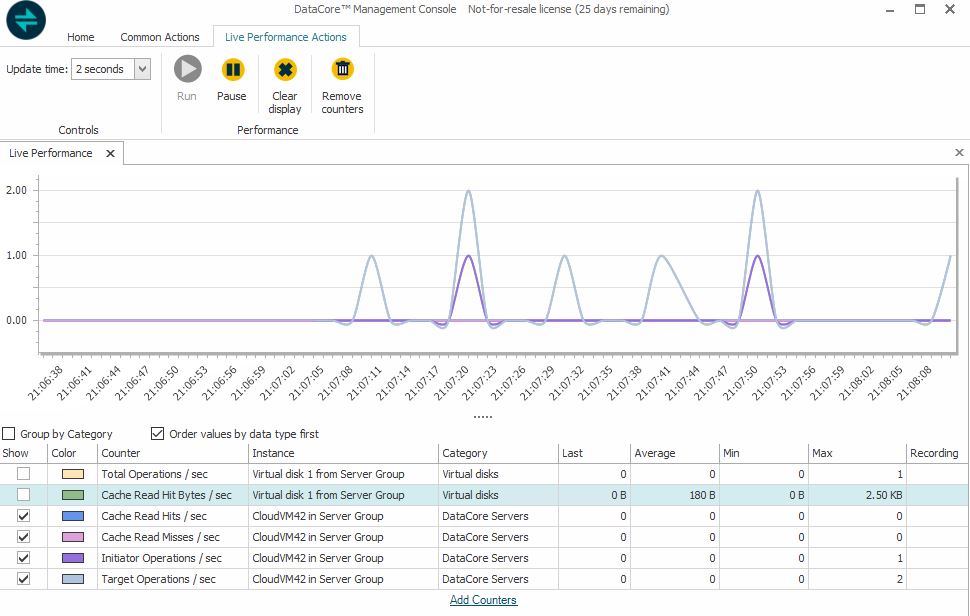
Counter information is updated every two seconds (default time) when data is received from the servers. The counters measure very specific information and can be used to isolate and diagnose specific performance bottlenecks in the SAN.
Live Performance shows traffic for DataCore Servers and hosts. The ability to view traffic metrics from all servers and hosts from a single point—on one server or other computer running theremotely—eliminates having to configure counters from several machines when troubleshooting a problem.
- The counters based on Average Time / IO (reads or writes) are calculated based on the total time per second that all I/Os took to complete divided by the total number of IOs per second.
- Counter data is received at the update interval (default time is two seconds); therefore, if no data is received for any time interval, it will not be displayed and will result in gaps in the graph data.
- In a highly available configuration, performance is aggregated and some counters reflect the command totals going to both DataCore Servers during a failover condition.
- Host performance only provides information about the initiator commands issued to target ports.
- Timestamps in the console are displayed according to the system time zone of the computer running the console.
How Performance Data is Presented
Full scope in the Main Live Performance tool
Live Performance for all objects can be displayed in the same window. The tool provides access to a complete list of counters for all objects. Performance data can be customized be selecting categories, instances (particular member of the selected category), and counters. For instance, if you choose the Virtual disks category, you can then select a particular virtual disk to monitor. When counters are added, the tool begins to run and data will be displayed. This tool is opened from the Ribbon in the Home tab, Diagnostics area.
The full scope tool has a few additional features, such as the ability to change the update time, pause and resume running the display and clear all counters.
Limited Scope for a Specific Object in the Details page
Live Performanceis limited to all counters for the specific object. Performance is provided on the Performance tab of the details page for every object including DataCore Servers and server groups, hosts, server and host ports, physical disks, disk pools, and virtual disks. When the Performance tab is opened, the tool begins to run. Some counters are added by default. Data is automatically gathered for the added counters and displayed. Counters can be added or deleted to fine-tune the scope of the data.
Counter Categories
Performance counters are logically classified by object category. Classifying the counters by object, as opposed to drivers, makes finding all device-related counters much easier and eliminates overlooking counters for users not familiar with the drivers. The counter data in each category may be gathered from one or more different DataCore device drivers. (Counter descriptions are revealed by hovering the mouse over the counter name or selecting the Show counter description check box when adding counters.)
Notes:
- To gather accurate overall performance data on shared pools, use the shared disk pools category instead of the disk pools category, and for shared physical disks, use the shared physical disks category instead of the physical disks category.
Opening the Tool
To open the Live Performance tool:
- In the Ribbon>Home tab, click Live Performance in the Diagnostics area. Controls appear in the Live Performance Actions tab in the Ribbon.
To open the performance tool for a specific object:
- Open the details page for the object and click the Performance tab on the page. Controls are contained in the tab.
Viewing Counter Descriptions
To view counter descriptions in the Live Performance tool:
- Open the Live Performance Tool from the Ribbon.
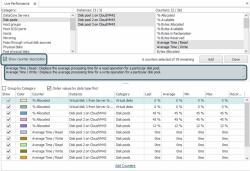
- Click Add Counters to open the list of available counters.
- Select the Show counter description check box. The description appears in the box below when a counter is selected.

To view counter descriptions in the Performance tab of the details page:
- Click the down arrow for the Add counters box.
- In the list, hover over the counter and a tool tip appears with the description. Descriptions for counters that have been added to the graph can also be viewed by hovering over the added counter at the bottom of the tab.
Adding or Removing Counters
Instructions are provided for adding or removing counters in the Live Performance Tool and the Performance Tab in the details page.
Calculation of counter values displayed in the graph begins when counters are added to the Live Performance tool. The values are cleared when a counter is removed from the view or the Live Performance tool is closed. The Clear button also clears the counter values. If a counter is added to the Live Performance tool and also to the Performance tab in a details page, the value will be cleared when it is removed from both Live Performance and the Performance tab in the details page or both tools are closed.
Live Performance Tool
A maximum of 50 counters total can be added to the graph. The number of counters currently selected to add to the chart and the number of counters that can be added to the chart to reach the total of 50 is displayed next to the Add button when counters are being added.
To add a counter in the Live Performance tool:
- Open the Live Performance Tool from the Ribbon>Home tab.
- Click Add Counters at the bottom of the page to open the counter selections.
- In the Category box, select the category.
- In the Instances box, select one or more SAN objects.
- In the Counters box, select one or more counters.
- Click Add. The counters will appear in the list below.
- After all counters are added, click Done.
Adjusting the data in the counter table under the graph:
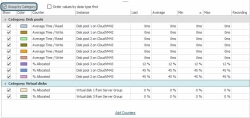
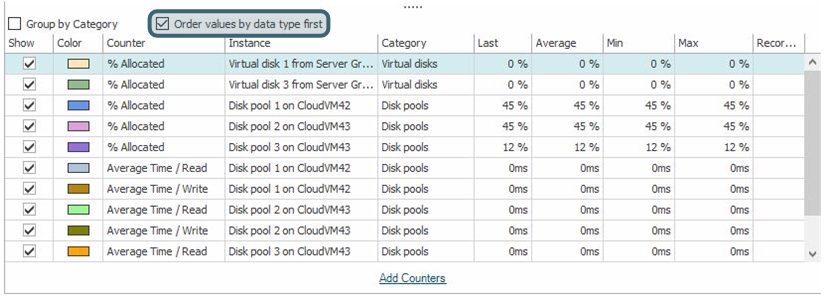
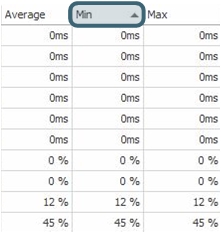
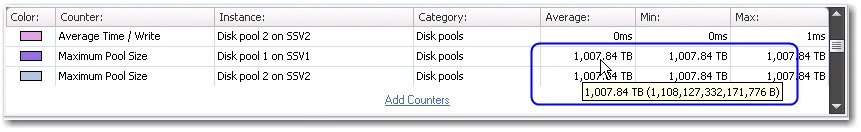
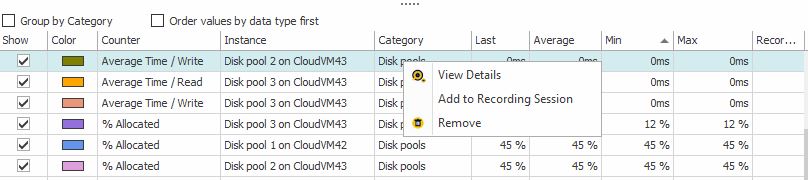
By default, the data (Last, Average, Minimum, Maximum) in the counter table is sorted by type and then by value. If the value is rounded, the actual value will be displayed in a tooltip.
- To sort counters by number, clear the Order values by data type first check box.
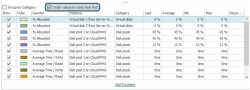
- To sort counters by number from either smallest to largest or largest to smallest, click on a column to get an arrow and click again to change the arrow direction.

- To sort counters by data type, select the Order values by data type first check box.
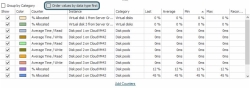
- To sort counters by category, select the Group by Category check box.
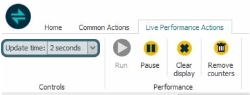
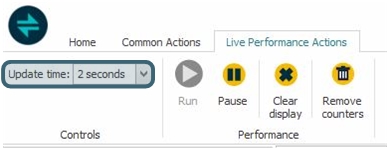
- The update time can be adjusted in the Ribbon>Performance Actions tab. The update time is the interval of time in which the data is provided. This can be set from one second to one hour. The default time is two seconds.
- Since counters are different data types (such as size, count, percent) and the sizes can be different (KB, MB, GB), scaling is done automatically and the values are displayed accordingly.


Adjusting the display of the counters in the graph:
- The check box in the Show column allows or prevents the display of counters in the graph without removing the counters from the counter table. By selecting or clearing the check boxes, a series of counters can be displayed together in the graph.

To remove a counter in the Live Performance tool:
- Open the Live Performance Tool from the Ribbon>Home tab.
- In the counter table, right-click on the counter to remove and select Remove Counter.
All counters can be removed from the table by clicking Remove counters in the Live Performance Action stab in the Ribbon.
Performance Tab in Details Pages
To add a counter in the performance tab in the details page:
- In the details page>Performance tab, in the Add counters box, click the arrow to reveal a list of counters applicable to the object.
- Select a specific counter or All counters from the list and click Add. The counter is added to the table of counters at the bottom of the page.
- Repeat to add additional counters.
To remove a counter in the performance tab in the details page:
- In the details page>Performance tab, in the counter table at the bottom of the page, right-click on the counter to remove and click Remove Counter. The counter is added back to the list of available counters.
Adding/Removing Counters in a Recording Session
Counters can be added to or removed from a recording session from the Live Performance tool. This feature is available from the main Live Performance tool and from the details page>Performance tab of a specific object.
The Recording column in the counter table shows whether or not added counters in the Live Performance tool are configured in the recording session and if the recording session is running.
- A green check
 is displayed when the counter is configured as an instance and the recording session is running.
 - A red pause symbol
 is displayed when the counter is configured as an instance but the recording session is stopped (idle).
 - A grey check
 is displayed when the counter is configured as a category and the recording session is running.
 - A grey pause symbol
 is displayed when the counter is configured as a category but the recording session is stopped (idle).
 - Nothing is displayed in the column if the counter is not configured in the recording session.
All counters added from the Live Performance tool are added to the recording session as an instance. Multiple selections are supported.
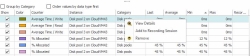
To add or remove a counter in a recording session:
- In the counter table, right-click on the counter and select Add to Recording Session or Remove from Recording Session.
Interpreting Graph Lines
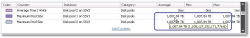
Live data for the counters added in the Live Performance tool are visually displayed in the graph and presented in the various columns in the counter table under the graph. Each counter is assigned a color in the list and the corresponding graph line appears in that color.
To view data for a specific counter:
Click on a counter in the table and the relevant graph line will stand out in the graph and be displayed with recording points. Each recording point in the graph contains data for the selected counter.
To view details of a recording point:
- Click on a recording point in the graph and details will appear.

Changing the Frequency of Data Updates
By default, counter data is updated in the tool every two seconds. This setting can be changed in the Live Performance when the tool is open.
- In Ribbon>Performance Actions tab, click the Update time drop-down menu and select a new value.
Clearing the Display
The current graph lines displayed in the tool can be deleted by clicking Clear display either in the Ribbon>Live Performance Actions tab or the details page>Performance tab.
Pausing/Resuming the Tool
This feature is available in the Live Performance tool.
- To pause the display, in the Ribbon>Live Performance Actions tab, click Pause.
- To resume running the display, in the Ribbon>Live Performance Actions tab, click Run.
Learn More