System Health Tool
Explore this Page
Overview
The System Health tool provides real-time and historical insights into the performance and status of SAN resources across the server group. It offers a centralized interface to view system health, bandwidth usage, storage capacity, and virtual disk performance.
Key capabilities include:
- Status of managed resources requiring attention
- Bandwidth measurements for ports, disk pools, and physical disks
- Storage capacity breakdowns
- Performance Spotlight, highlighting key performance statistics for virtual disks
Accessing the System Health Tool
To open System Health:
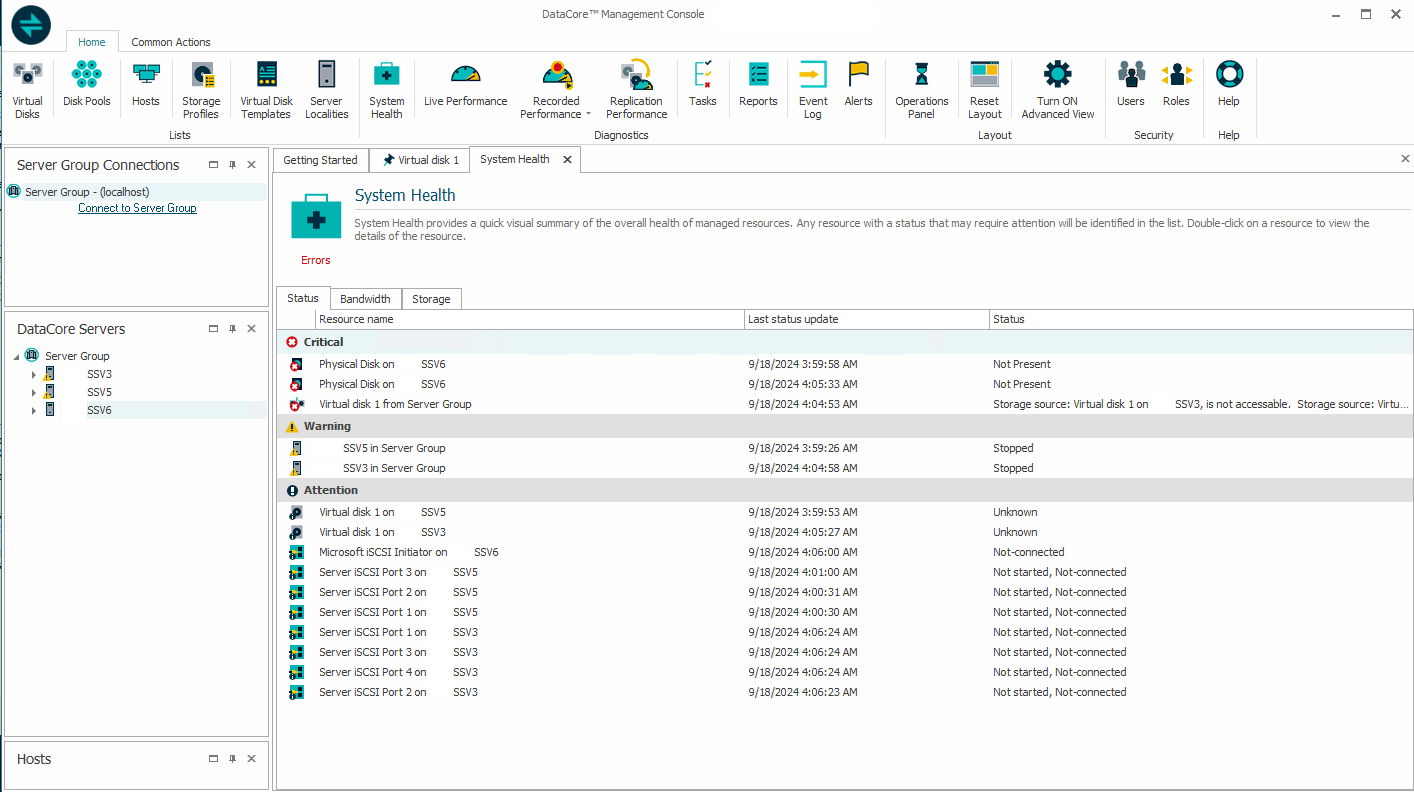
Status
The Status tab in System Health tool provides a quick visual summary of the overall health of resources managed by DataCore SANsymphony software. Resources can include DataCore Servers, hosts, ports, physical disks, disk pools, virtual disk sources, virtual disk sources with data protection, virtual disks (snapshots, rollbacks, local and remote replications), and replication servers.
Internal system monitors report events when status changes for a managed resource. Events occurring in the SAN are classified by severity, time-stamped (the timestamp format is DAY-MO-YR TIME) and reported in the tool. Status of a resource is presented in a single message and is displayed according to the severity; higher severities are displayed before lesser severities. At a glance, any managed resource requiring attention can be identified in the tool. Double-click on a message in the list to view details of the object. This tool can be kept open and active in your workspace to continually monitor the health of your SAN resources.
Physical disks with S.M.A.R.T. (Self-monitoring, Analysis and Reporting Technology- also known as SMART) implementation are monitored for predicted drive failure.
Security Classifications (highest to lowest):
| Icon | Security Classification | Description |
|---|---|---|
|
|
Critical |
This resource has received a status which is unhealthy and requires immediate attention. |
|
|
Warning |
This resource has received a status which requires attention. Check this resource and take action to ensure it does not reach a critical status. |
|
|
Attention |
This resource may require attention. Verify the status condition. |
Each message may contain multiple reports containing different severity classifications. The message will be displayed under the highest severity classification. For instance, If a Fibre Channel port is Not-connected (Attention severity) and the Loop/Link is down (Critical severity), then this message is reported under the Critical classification at the top of the list.
A virtual disk with Cyber Resiliency Mode enabled shows system health warnings if the Cyber Resiliency criteria are not met, signalling the need for immediate action to restore a healthy rating. The status bar provides detailed information about the state of the virtual disk. This serves as an immediate alert, helping users quickly identify which virtual disks are at risk and need further investigation or intervention.
System Health messages are displayed as long as they are valid. If the System Health tool is open and no messages are displayed, then all managed resources are healthy.
Link errors have to be manually reset in order to remove them from System Health. See Resetting Link Error Counts.
Bandwidth
The Bandwidth tab in System Health provides measurements associated with bandwidth to provide an overall view of network traffic. This tab can be used to identify specific SAN resources using excessive bandwidth. Measurements are provided for all front-end and mirror ports, disk pools, and physical disks for each DataCore Server in the server group. Data is refreshed frequently. Throughput, latency, and I/Os per second for each SAN resource is provided in real time.
Expand the objects in the tree to view all measurements for the DataCore Server. Comparatively high latency figures for a SAN resource may indicate potential network issue and identify where to begin troubleshooting in the server group when a bottleneck is suspected.
Bandwidth Measurements
- Throughput
- Front-end Throughput = Amount of data received by the target port.
- Mirror Throughput = Amount of data received by the mirror target port. (Data sent by a port as an initiator is not counted.)
- Back-end Throughput = Amount of data sent by the initiator port.
- Physical Disk Throughput = Time of I/O completion. This is on the Initiator end and includes the transfer layer time.
- Disk Pool Throughput = Time of I/O completion.
- Latency is the average data transmission delay displayed in milliseconds.
- IO/s (IOs per second) is the average number of read and write operations performed.
Storage
The Storage tab in System Health provides pie charts for a quick visual representation of the storage in the server group. The Licensed Storage Capacity pie chart represents the regular storage in the group. See Server Group Details for server group licensing.
Licensed Storage Capacity
Licensed Storage Capacity is the amount of storage that is licensed for the server group. Licensed storage capacity includes allocated, free, and unconfigured storage. DataCore disks are not included in the Licensed Storage Capacity view.
Total Storage Capacity is the amount of storage that is licensed for the server group includingDataCore disks. Total storage capacity includes allocated, free, unconfigured, and DataCore disks (allocated and free). To view the total storage capacity, select the Show DataCore disks check box in the Storage tab.
The following storage categories can be displayed in the Licensed Storage Capacity pie chart:
The different storage categories displayed in the pie chart are calculated and displayed as a percentage of the entire amount. Percentages are rounded to the nearest whole percent. A category must be at least 1% of the whole in order to be displayed in the pie chart. The different categories of storage are color-coded in a key next to the chart.
- Allocated storage is the amount of physical storage that is currently in use. This includes storage allocation units (SAUs) that have been allocated from disk pools and used by pass-through disks that are being managed by the software.
- DataCore disks - Free is the amount of storage in DataCore disks that is not allocated. *
- DataCore disks - Allocated is the amount of storage in DataCore disks that is currently in use as storage. *
* DataCore disks are virtual disks created by DataCore Servers and served to DataCore Servers in the same server group where they may be used as storage. This category will only be displayed in the Total storage capacity view of the chart when the Show DataCore disks check box has been selected.
- Expansion limit is the percentage in use (allocated and free) of the maximum amount of licensed storage for the server group at the current license level.
- Free storage is the amount of storage that has been added to pools and is available for use, but not allocated.
- Unconfigured storage is the difference between the amount of licensed storage and the amount of storage that is currently configured (allocated and free storage) in disk pools and pass-through disks. For instance, if the licensed storage capacity is 10 TB and the amount of configured storage (allocated and free) is 2 TB, the unconfigured storage would be 8 TB.
Learn More