Dashboard
Explore this Page
Overview
The DataCore Insight Services dashboard provides a centralized, at-a-glance view of your SANsymphony environment. It aggregates data from all connected server groups within the organization to deliver actionable insights into capacity usage, system activity, and configuration status.
From the dashboard, you can:
- View allocation distribution, including allocated and free capacity across the environment.
- Monitor allocation history to understand capacity trends over time.
- Access key metrics such as the total number of insights, virtual disks, and connected server groups.
- Quickly navigate to detailed views for Insights and Server Groups.
- Generate a configuration report for environment analysis and auditing.
SANsymphony Dashboard
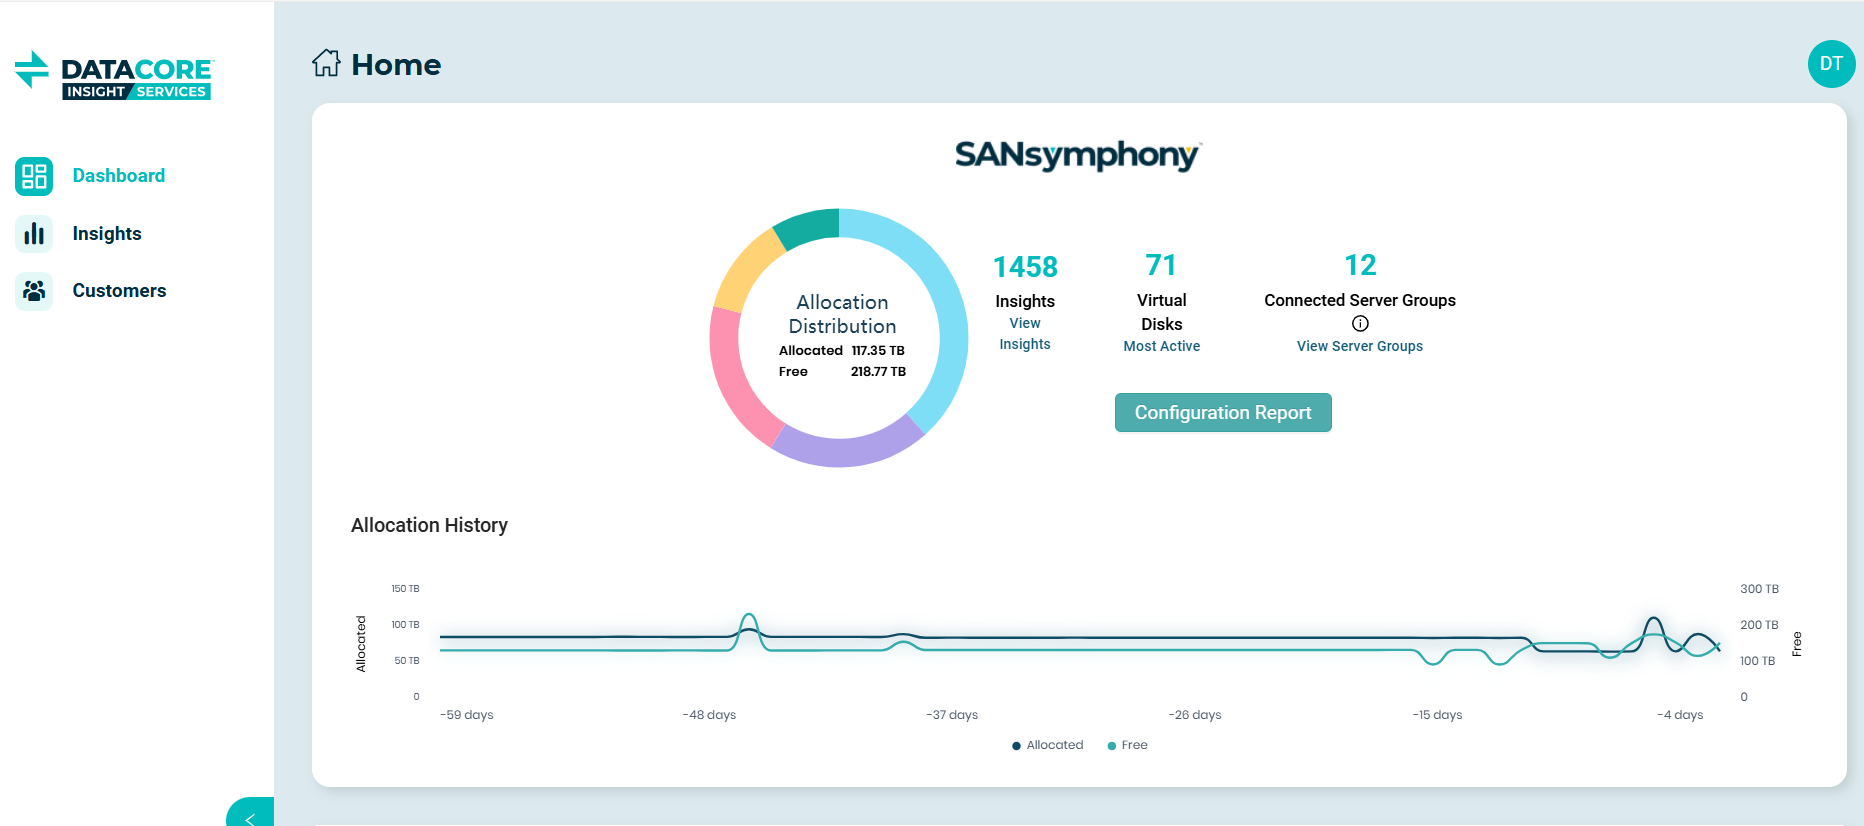
The SANsymphony Dashboard offers a centralized view of capacity usage, system insights, virtual disk activity, connected server groups, and access to configuration and health reports across the SANsymphony environment.
- Allocation Distribution: The Allocation Distribution view displays aggregated allocated and free capacity across all connected SANsymphony server groups, providing a high-level overview of capacity usage.
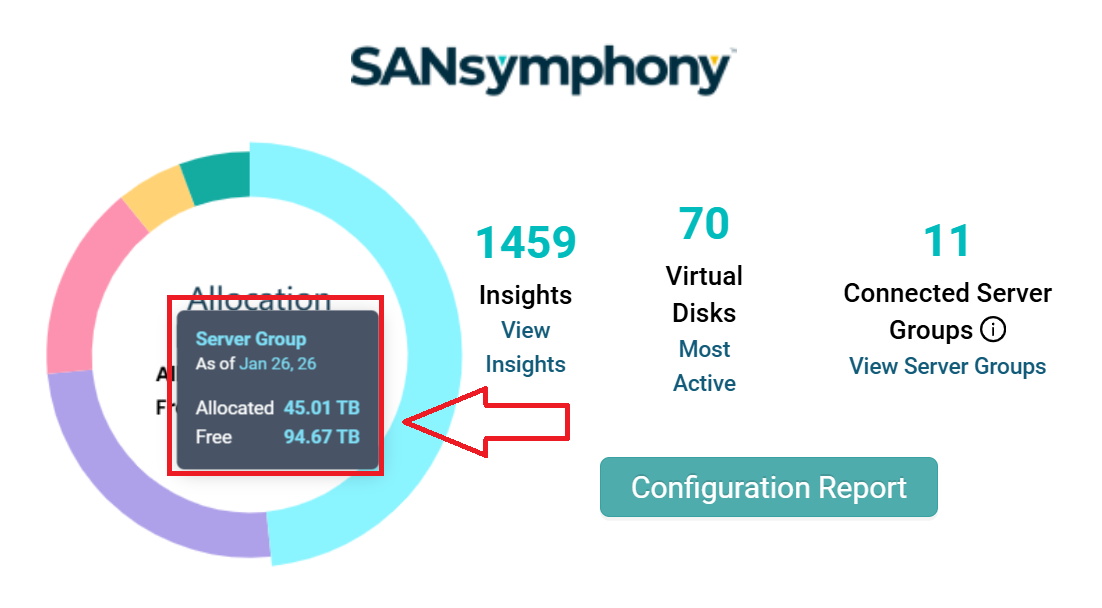
- Clicking a segment in the Allocation Distribution chart opens the SANsymphony capacity drill down view for the selected server group, where capacity details are displayed from the server group level down to individual pools. Server groups must meet the required minimum SANsymphony version to appear in the drill-down view. The Information icon on the Server Group tab indicates version requirements.
- Example: If an organization has multiple SANsymphony server groups reporting data, the Allocation Distribution chart displays the aggregated allocated and free capacity across all server groups. Selecting a segment in the chart opens the SANsymphony capacity drill down view, where capacity details for individual server groups can be reviewed. The selected server group is expanded in the drill-down view to display capacity information down to the pool level.
- For more information about capacity metrics and predictive analysis, see SANsymphony Capacity Drill Down
- Insights: Displays the total number of insights generated for the SANsymphony environment. Clicking the View Insights link opens the Insights view, where insights are displayed at the SANsymphony server group level, providing visibility into active system conditions and recommendations.
- Virtual Disks: Indicates the total number of virtual disks configured across all SANsymphony server groups, providing a quick overview of virtual disk activity within the environment. Clicking the Most Active link opens the detailed view showing virtual disk activity by server group.
- Connected Server Groups: Displays the number of SANsymphony server groups that have successfully reported performance data within the past 48 hours. Clicking the View Server Groups link navigates to the Server Groups view for detailed server group information.
- Configuration Report: The Configuration Report button displays a list of available SANsymphony server groups. When you select a server group, you are redirected to the associated SANsymphony Health Report. For more information, see SANsymphony Health Report.
SANsymphony Monitoring and Analysis
This section describes the monitoring and analysis capabilities available for SANsymphony in DataCore Insight Services. It includes capacity visibility, configuration and health reporting, pool-level performance monitoring, and heat map–based analysis to help you understand capacity utilization, system health, and storage behavior across server groups and pools.
SANsymphony Health Report
The SANsymphony Health Report provides a consolidated view of the configuration and health details of a selected server group.
You can access the health report by clicking the Configuration Report button available on the SANsymphony dashboard. This opens a list of SANsymphony server groups, from which you can select a server group to view its corresponding health report.
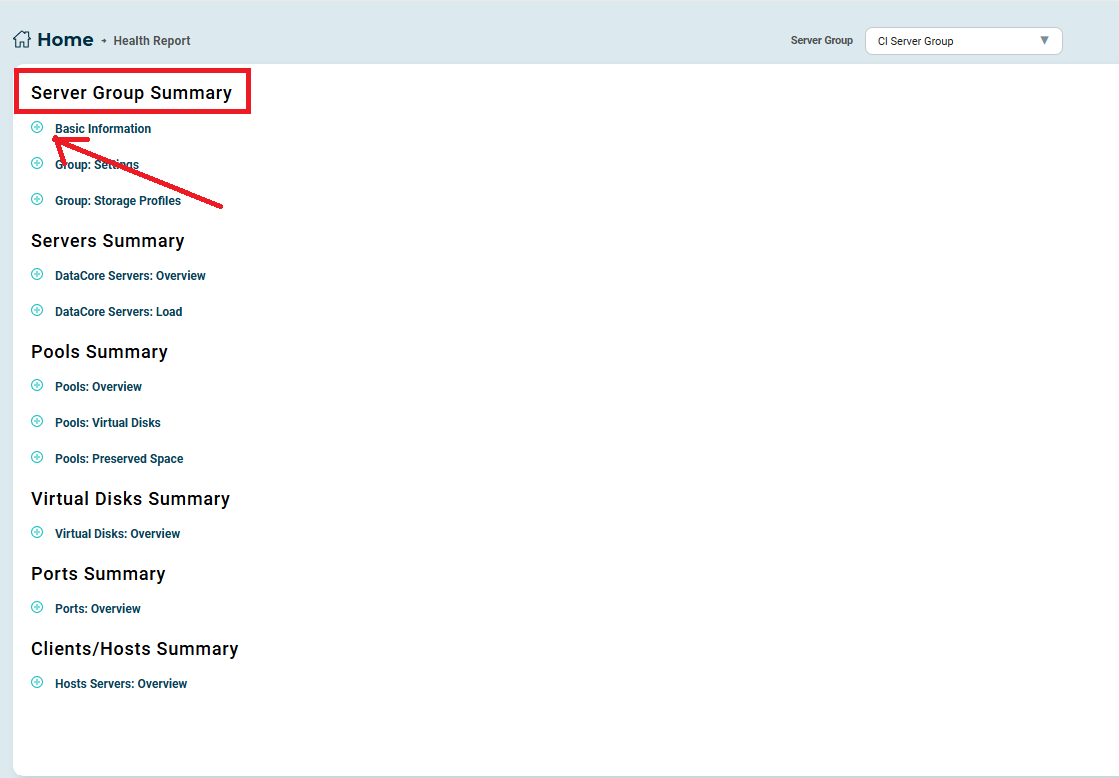
You can select a SANsymphony server group from the Server Group drop-down displayed at the top of the health report to view the health report for another server group mapped to your organization. When you click the + icon, the selected section expands to display additional details for the server group, including:
- Server Group Summary: Displays basic information, group settings, and storage profiles for the server group.
- Server Summary: Displays overview and load information for the DataCore servers in the group.
- Pools Summary: Displays pool overview, virtual disk information, and preserved space details
- Virtual Disks Summary: Displays overview information for virtual disks.
- Ports Summary: Displays overview information for ports.
- Clients/Hosts Summary: Displays overview information for host servers.
Clicking Expand All displays all sections and their subsections, while clicking Collapse All hides all expanded details at once. By default, only the Server Group Summary section is expanded, with its primary subsection visible.
SANsymphony Capacity Drill Down
The SANsymphony capacity drill-down view allows you to monitor capacity metrics from the Server Group level down to individual Pools. It provides visibility into server groups, associated servers, pools, and pool-level capacity values to help you understand overall capacity utilization across the environment.
From the Server Group view, you can expand a server group to see its associated pools. Selecting a pool allows you to navigate to detailed Pool Performance views, including heat map–based tier analysis. For more information, see Pool Performance and Heat Map Analysis.
For each pool, the Capacity section displays detailed metrics such as Total, Free, Allocated, Provisioned, Served, Over Subscribed, and Used capacity. These values help you assess current utilization at the pool level.
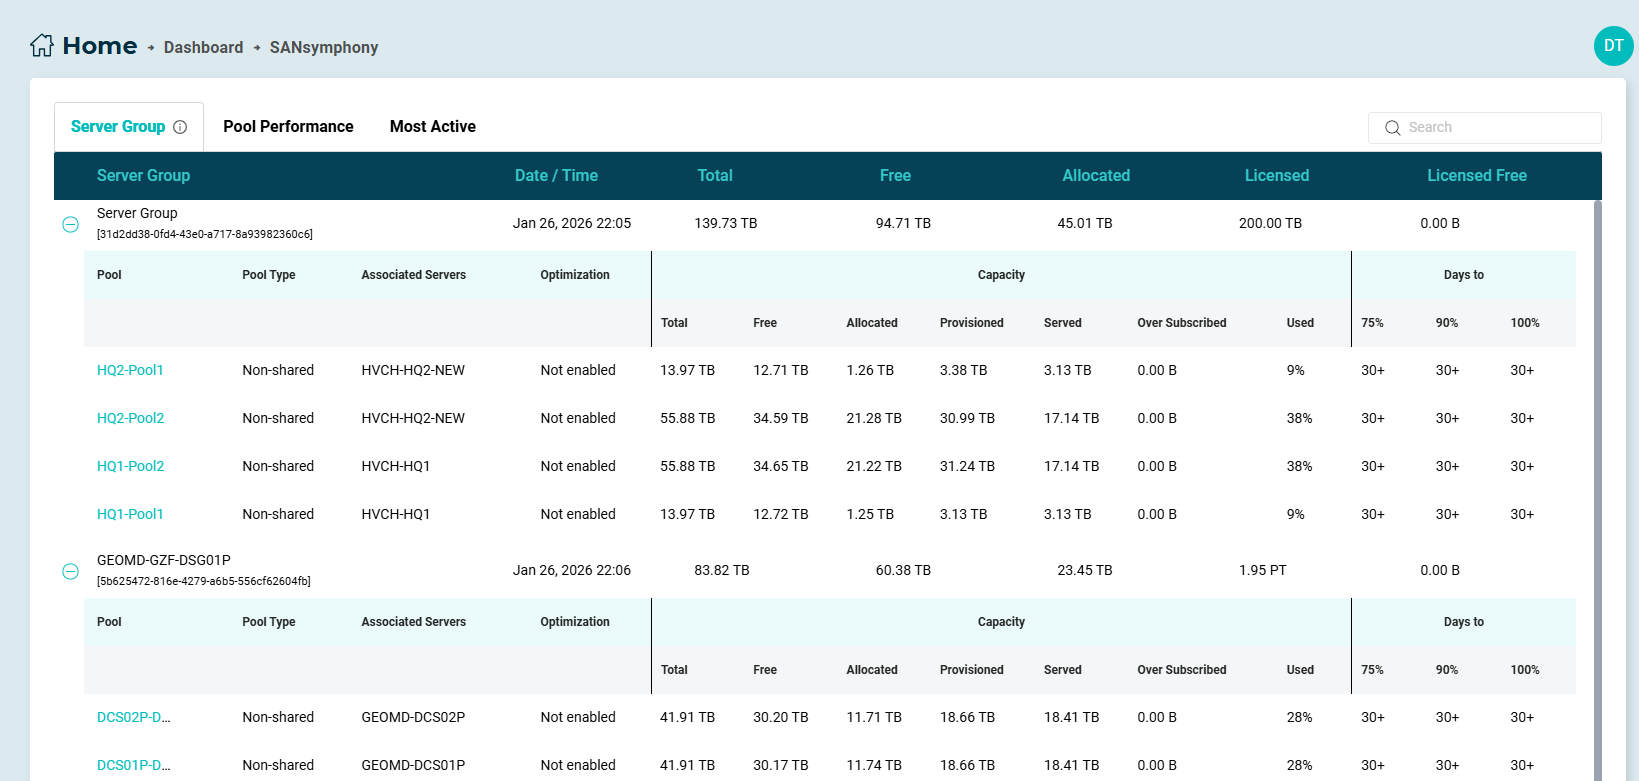
- The Days to columns show predictive capacity information, indicating the estimated number of days remaining to reach 75%, 90%, and 100% of the configured pool capacity. The maximum duration shown for predictive analysis is 30 days. Any value exceeding this limit is displayed as “30+”, with no additional breakdown available.
- The Information icon on the Server Group tab indicates the minimum SANsymphony version required for the server group. If the server group does not meet the minimum version requirement, its details are displayed as “N/A”.
The values displayed in the drill-down view help you evaluate capacity usage from the server group through the pool level and identify when corrective actions may be required to ensure uninterrupted operations.
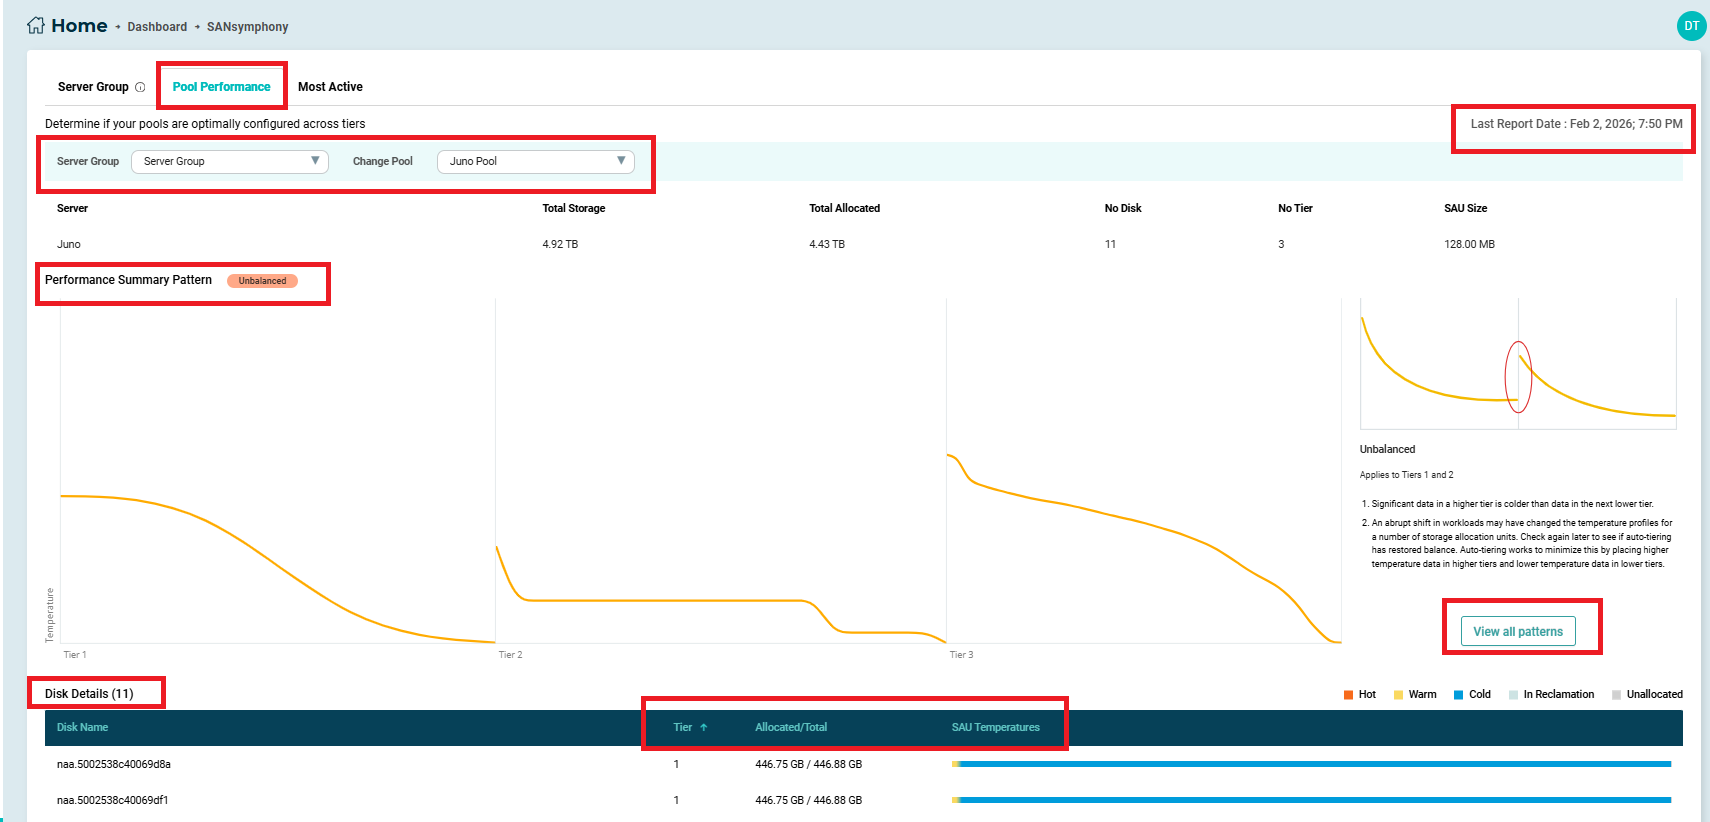
Pool Performance
Pool performance view enables you to monitor pool-level performance and SANsymphony Automated Storage Tiering (auto-tiering) functioning in SANsymphony using heat map data collected by the telemetry agent. You can access the heat maps for a pool from the Pool Performance tab or by clicking a pool displayed under the server group from the SANsymphony Capacity Drill Down report. For more details, see Heat Map Analysis.
This view complements capacity information by providing performance-focused insights that help you correlate capacity utilization with workload activity.
Heat Map Analysis
For a selected pool, the Pool Performance view displays a performance summary pattern that allows you to analyze heat map data. The performance summary pattern is a graphical representation that shows storage tiers and the classification of a pool based on the temperature curve derived from heat map data.
Using the performance summary pattern, you can:
- View storage tiers and pool classification based on the temperature curve derived from heat map data
- Analyze the distribution of workload temperature within and across tiers, displayed using box plots.
- Understand workload behavior and conditions at tier boundaries.
From this view, you can also:
- Select View all patterns to browse different performance pattern types and their descriptions.
- Choose a different pool from the Change Pool drop-down.
- Switch server groups using the Server Group drop-down.
- View the Last Report Date, which indicates when the pool performance data was last collected.
Disk Details
Below the performance summary pattern, you can view physical disk details for the selected pool, including:
- Tier information
- Allocation details
- Storage Allocation Unit (SAU) temperature distribution.
Refer to Disk Pools for more information.
Learn More