Event Log and Alerts
Explore this Page
- Overview
- Opening the Event Log and Viewing Messages
- Searching the Event Log
- Viewing and Acknowledging Alerts
- Removing Log Contents
Overview
The Event Log tracks system events and configuration changes, categorized by severity—informational, warning, or error. It provides an audit trail of activity and helps identify issues through alerts triggered by critical conditions. The log supports search, filtering, and viewing of detailed message history. See Viewing Alerts for more details.
Opening the Event Log and Viewing Messages
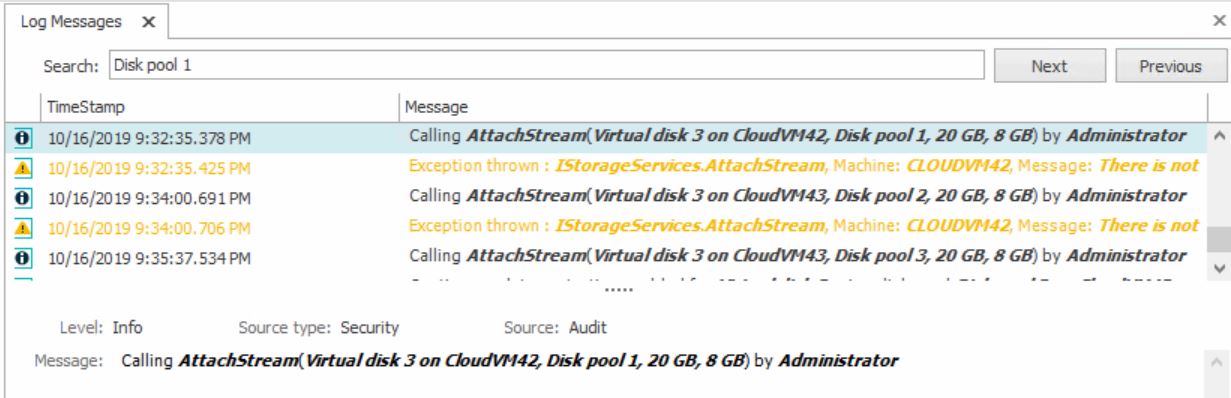
The DataCore SANsymphony Event Log consists of a search area and filter, chronological list of messages, and message text area.
When the Event Log is opened, all messages are displayed according to the timestamp with recent messages at the bottom of the list.
The timestamp is the exact time and date of the event. Timestamps are provided in the original time zone where the occurrence happened. The format is YEAR-MO-DAY and 24-hr time.
To open the Event Log and view messages:
- For a global view of all events:
- In the Ribbon>Home tab, click the Event Log button.
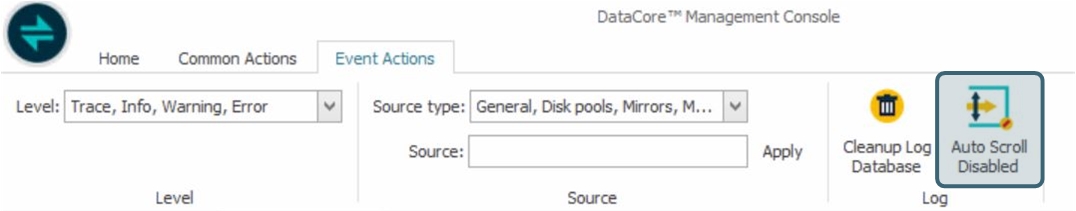
- The Event Actions tab opens in the Ribbon. Use the tab to select the server and message level to limit the type of messages displayed.
- Click a message in the list to view the details at the bottom of the page. (See following table.)
- For a view of all events for a specific object:
- In the DataCore Servers panel or Hosts panel, double-click on the object to open the details page.
- Click the Events tab.
- In the Ribbon, select the server and message level to limit the type of messages displayed.
- Click a message in the list to view the details at the bottom of the page.
| Message Text Area in the Event Log | |
|---|---|
| Level |
Message type. Possible levels include: Info, Warning, Error, and Trace (Information used by DataCore Technical Support for diagnostic purposes). The message level displayed in the log can be changed in the Ribbon when the log is open. |
| Source type |
The type of message. Most types are self-explanatory with these exceptions:
Source types displayed in the log can be filtered in the Event Actions tab in the Ribbon when the log is open. |
| Source | The source of the message. This could be a particular SAN component object or can be service related. |
|
Message text |
Displays the entire message which could be longer than the description in the message list. |
During the collection of support bundle files, logging in the Event log will pause and messages in the Event Log will disappear until the collection is completed, then logging will resume. During support bundle collection, a message in red will be displayed in the Event Log that logging is paused.
Auto Scrolling
Log messages are displayed from oldest (top of the list) to most recent (bottom of the list). When auto scrolling is enabled and the Event Log is opened, a view of the most recent messages at the bottom of the list is provided. When auto scrolling is disabled and the Event Log is opened, the log displays the least recent log messages starting at the top of the log.
To enable or disable auto scrolling:
- Open the Event Log and in the Ribbon, click Auto Scroll Enabled or Auto Scroll Disabled.
Auto-scrolling is only available in the global Event log.
Searching the Event Log
More specific messages can be located by performing text searches or using the filter.
To perform a text search:
- At the top of the Event Log tab, enter the text phrase in the Search box.
The text string entered will be searched for as entered, including quotes and spaces. The wildcard asterisk character (*) is supported as a character substitute (zero or more characters). The text string is not case sensitive.
- The text search will begin from the selected message (highlighted in blue). Click Next or Previous to find the occurrences in the message list.
Filtering
To use filtering features to narrow the scope of displayed messages:
Filtering is only available in the global Event log.
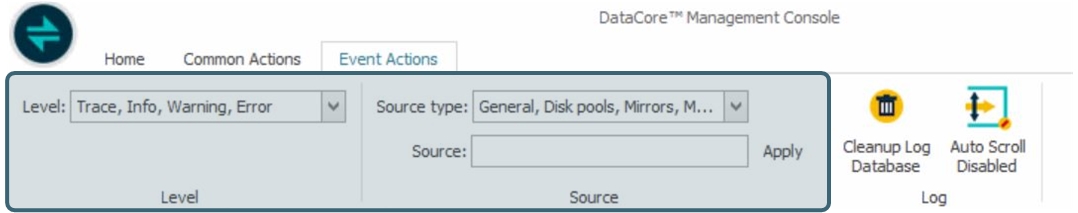
- In the Ribbon>Home tab, click Event Log to open the log and then and click Ribbon>Event Actions tab.
- In the Level area:
- In the Level box, click the arrow to open the drop-down box.
- In the list, clear or select the check boxes for the message types to display.
- Click OK.
- In the Source area:
- In the Source type box:
- Click the arrow to open the drop-down box.
- In the list, clear or select the check boxes for the component types to display.
- Click OK.
- To search for specific object, in the Source box:
- Enter the specific text to search for.
- Click Apply.
- In the Source type box:
Settings are not saved when the Event Log is closed.
Viewing and Acknowledging Alerts
An alert is an urgent notification of a high priority event. Alerts are generated by DataCore SANsymphony software when an event occurs that requires immediate attention. Alerts can also be user-generated as an action from a task.
When a high priority event is posted in the event log, the alert flag in the right corner of the status bar changes color from grey to red and a balloon message will appear briefly. The alert should be viewed and acted upon immediately.
To view and acknowledge alerts:
- In the status bar, click the red flag in the status bar to open the Active Alerts dialog box. The dialog box can also be opened from the Ribbon>Home tab.
- Select each message in the list and read the message detail at the bottom of the page. Take appropriate actions based on the alerts.
- When all alert messages are no longer needed, click Acknowledge All to remove the alerts and reset the alert flag in the status bar. The events will remain documented in the Event Log.
Removing Log Contents
When the Event Log becomes too long, all currently displayed messages can be removed from the log, including alerts. When the log is "cleaned up" all messages are saved in a log file (.dcsl) in the folder where the program files were installed. The file will begin with "Dcsx_" and have the timestamp appended. For example: Dcsx_2010_10_12_09_24_40.dcsl would be the name of a file when the log was cleaned on October 12, 2010 at 9:24.40 am.
- The event log is automatically cleaned up when approximately 1,000,000 messages or 2 GB is consumed by the log. At that time, all unacknowledged alerts will be removed and the alert flag in the status bar will be reset.
- Before cleaning up the log, ensure all log messages and alerts are unnecessary.
- Ensure that there is always sufficient free space for the Event Log; otherwise, logging will stop. If logging is stopped due to insufficient space on a server (even if a cleanup is performed), in order to create a new log file you must stop and restart the DataCore Server.
To delete log messages:
- Open the Event Log and in the Ribbon>Event Actions tab, click Cleanup Log Database.
- Click Yes on the confirmation message to continue.
Learn More