Prometheus Exporter for DataCore SANsymphony
Introduction
A PowerShell-based Prometheus Exporter for DataCore SANsymphony enables you to collect and monitor SANsymphony performance metrics using the Prometheus and Grafana monitoring stack. A PowerShell script queries the SANsymphony REST API, formats the metrics data in Prometheus exposition format, and writes it to .prom files.
The metrics in the .prom file is exposed to Prometheus using the community-supported Windows Exporter with the textfile collector enabled. Prometheus periodically scrapes the metrics, stores them in its time-series database, and optionally makes them available for visualization through Grafana dashboards.
This guide provides step-by-step instructions to configure the exporter using the PowerShell script, set up Prometheus scraping, and optionally visualize the collected metrics using Grafana.
For more information about the DataCore SANsymphony, refer to the DataCore SANsymphony Help.
Architecture
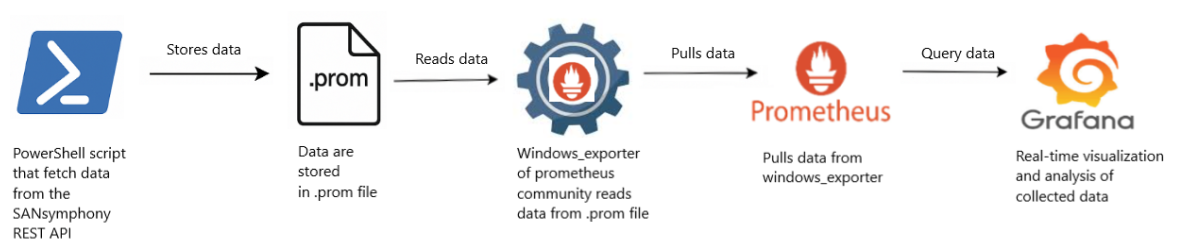
The following flow illustrates how SANsymphony performance metrics are collected and visualized using Prometheus and Grafana:
- PowerShell Script: The PowerShell script "DcsPrometheusExporter.ps1" connects to the SANsymphony REST API, collects key performance and operational metrics, formats them in Prometheus exposition format, and writes them to a .prom file.
- Windows Exporter: Uses its textfile collector to read the DcsPrometheusMetrics.prom file and expose the metrics at an HTTP endpoint for Prometheus.
- Prometheus: Periodically scrapes the metrics from the Windows Exporter endpoint and stores them in its internal time-series database.
- Grafana: Queries Prometheus as a data source to visualize the collected SANsymphony metrics in customizable dashboards for monitoring and analysis.
Learn More