Configuring the PowerShell Script
Explore this Page
- Overview
- Configure the PowerShell Script for SANsymphony Metrics
- Scraping .prom File Metrics Using Prometheus Exporter
- Scraping Metrics in Prometheus
- Verifying SANsymphony Metrics in Prometheus
- Visualizing SANsymphony Metrics in Grafana
Overview
This topic provides instructions for configuring and running the Prometheus-based PowerShell script to collect the SANsymphony performance metrics in Prometheus exposition format. It includes guidance on setting up the DcsPrometheusExporter.ps1 script and its associated DcsPrometheusExporter.psd1 configuration file, securely storing SANsymphony REST API credentials, and defining the output location for the generated .prom file. The topic also explains how to integrate with Windows Exporter and Prometheus using the Prometheus textfile collector to enable scraping and visualization of the exported metrics.
Configure the PowerShell Script for SANsymphony Metrics
Follow the step-by-step guidance to configure the DcsPrometheusExporter.ps1 PowerShell script and its associated DcsPrometheusExporter.psd1 configuration file. This setup enables you to collect SANsymphony performance metrics, format them in Prometheus exposition format by running the script, and export them to a .prom file at a specified location for further integration with Prometheus.
Step-by-Step Procedure
- Clone or download the PowerShell script file DcsPrometheusExporter.ps1 and its corresponding configuration file DcsPrometheusExporter.psd1 to your local system.
-
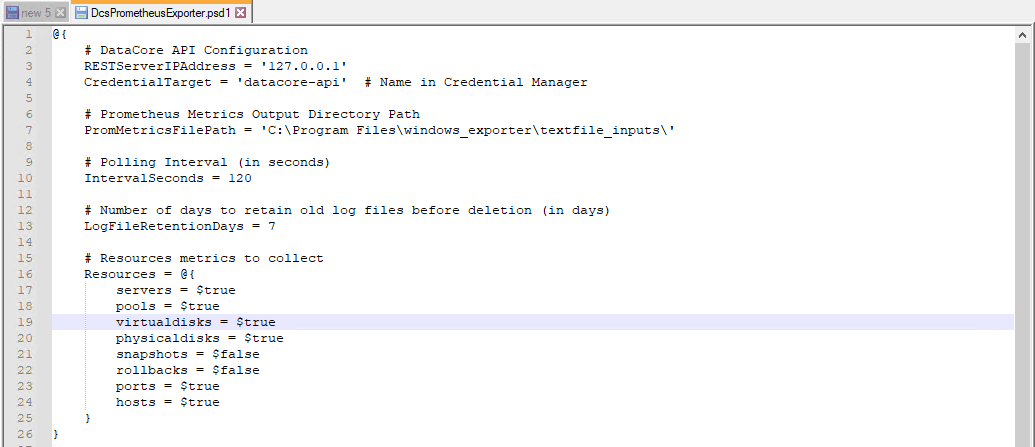
You can edit the DcsPrometheusExporter.psd1 configuration file to customize how the script collects and outputs SANsymphony metrics:
- RESTServerIPAddress: The default is 127.0.0.1, which refers to the local SANsymphony server. You can replace this with the IP address of your SANsymphony system if it's running on a different server.
- CredentialTarget: The default is 'datacore-api'. This must match the name of the credentials stored in Windows Credential Manager. You can change it as needed. See the below steps for instructions on how to create the required stored credential using PowerShell.
-
To configure a Windows Credential Manager, run the following commands in PowerShell to install the required module and create a stored credential. Copy
Command
CommandInstall-Module -Name CredentialManager
New-StoredCredential -Target 'datacore-api' -UserName 'resserver-username' -Password 'restserver-password' -Persist LocalMachine - Replace 'restserver-username' and 'restserver-password' with valid SANsymphony REST API credentials.
- Ensure the Target value (e.g., 'datacore-api') matches the CredentialTarget defined in the DcsPrometheusExporter.psd1 configuration file.
-
To configure a Windows Credential Manager, run the following commands in PowerShell to install the required module and create a stored credential.
- PromMetricsFilePath: Default is C:\Program Files\windows_exporter\textfile_inputs\. You can change this to any valid directory where the .prom file should be saved.
- IntervalSeconds: Default is 120. Modify this value to change how frequently metrics are collected, in seconds. (Note: This value is used only for manual execution of the script.)
- LogFileRetentionDays: Default is 7. Adjust this setting to define how many days the log files are retained before being automatically deleted.
- Resources: By default, most resource metrics in configuration file are set to $true while a few such as Snapshot and Rollback may be set to $false. You can modify these values as needed by setting $true to include a metric or $false to exclude it from collection. Only the resources set to $true will be queried and included in the Prometheus output.
- Run the Script:
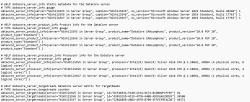
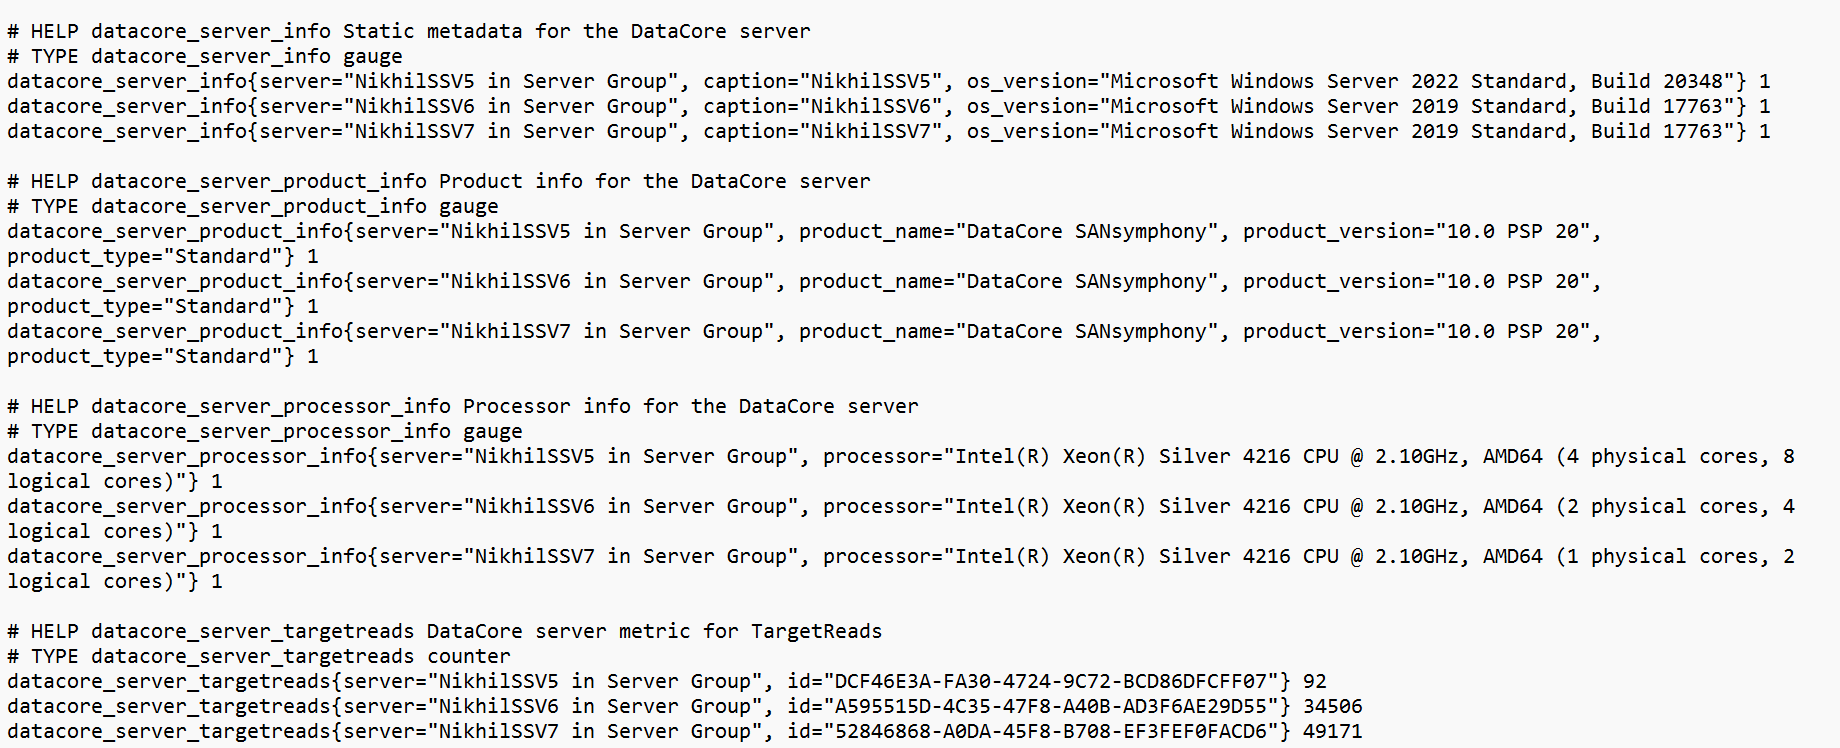
- When executed, the PowerShell script connects to the SANsymphony REST API, collects key performance and status metrics, formats them in Prometheus exposition format, and writes the output to DcsPrometheusMetrics.prom file.
- Example output of a generated DcsPrometheusMetrics.prom file.
- By default, the DcsPrometheusMetrics.prom file is saved to:
- This is the default directory monitored by the Windows Exporter (when the textfile collector is enabled), allowing it to read the metrics and expose them to Prometheus.
- If needed, you can specify a custom output path for the .prom file by editing the DcsPrometheusExporter.psd1 configuration file. The PowerShell script (DcsPrometheusExporter.ps1) automatically loads this configuration and writes the .prom file to the directory defined in the DcsPrometheusExporter.psd1 file.
- Executing the Script: The DcsPrometheusExporter.ps1 script must be executed periodically to update the metrics in the DcsPrometheusMetrics.prom file. You have two options for running the script:
- Manual Execution: Run the DcsPrometheusExporter.ps1 script manually using PowerShell. By default, it collects metrics every 120 seconds (as defined by IntervalSeconds in the DcsPrometheusExporter.psd1 configuration file). You can modify this interval as needed.
- To run the script manually in continuous mode, use:
Automated Execution (Recommended): Use Windows Task Scheduler to run the script at fixed intervals. This ensures the DcsPrometheusMetrics.prom file stays up to date without manual intervention.
- For each scheduled run, execute the script in one-time mode using:
- Recommended Frequency: Configure the task to run every 2 minutes or adjust it to match your desired interval. For automated runs, configure the interval directly in Task Scheduler.
Ensure that the user account running the scheduled task has access to Windows Credential Manager before scheduling the DcsPrometheusExporter.ps1 script. For setup instructions, refer to the credential configuration steps provided in Step 2.
- Manual Execution: Run the DcsPrometheusExporter.ps1 script manually using PowerShell. By default, it collects metrics every 120 seconds (as defined by IntervalSeconds in the DcsPrometheusExporter.psd1 configuration file). You can modify this interval as needed.
- Once the DcsPrometheusMetrics.prom file is created, you must configure Windows Exporter with the textfile collector enabled to read the DcsPrometheusMetrics.prom file and expose its metrics, allowing Prometheus to scrape them from the configured exporter's endpoint. See Scraping .prom File Metrics Using Prometheus Exporter.
Scraping .prom File Metrics Using Prometheus Exporter
Once the DcsPrometheusExporter.ps1 script is executed and the DcsPrometheusMetrics.prom file is created, the next step is to expose these SANsymphony metrics to Prometheus. This is done by configuring the Using Windows Exporter (from the Prometheus community) to read the DcsPrometheusMetrics.prom file and make its contents available for scraping.
The Windows Exporter includes a textfile collector, which reads metrics from DcsPrometheusMetrics.prom file and publishes them to an HTTP endpoint in a Prometheus-exposition format. This collector must be explicitly enabled in the exporter's configuration.
- Without enabling the textfile collector and pointing it to the correct file path, Prometheus will not be able to access SANsymphony metrics.
- For more details and the latest release, visit the prometheus-community/windows_exporter.
Using Windows Exporter
- You can download and install the latest Windows Exporter release from Releases_prometheus-community/windows_exporter.
-
Configure config.yaml
- Edit the Windows Exporter's config.yaml file (usually located at C:\Program Files\windows_exporter\) to enable required collectors and specify the directory for reading DcsPrometheusMetrics.prom file.
-
You can scrape the metrics from the default location or specify the custom directory.
- Option-1: Use the default .prom file location. The DcsPrometheusMetrics.prom file should be located at: C:\Program Files\windows_exporter\textfile_inputCopy
collectors:
  enabled: "cpu,logical_disk,net,service,system,textfile"
  service:
    include: windows_exporter
log:
level: info - Option-2: You can specify a custom directory to read the metrics.
Copy
collectors:
  enabled: "cpu,logical_disk,net,service,system,textfile"
  service:
    include: windows_exporter
collector:
  textfile:
    directories: "C:\\Program Files\\DataCore\\SANsymphony\\PrometheusMetrics\\PromMetrics"
log:
  level: info
- Option-1: Use the default .prom file location. The DcsPrometheusMetrics.prom file should be located at: C:\Program Files\windows_exporter\textfile_input
- After updating the configuration, restart the windows_exporter service.
-
Open a browser or use a tool like curl to check the exported metrics:
Copy
http://localhost:9182/metrics - This endpoint should display all metrics, including those parsed from the DcsPrometheusMetrics.prom file generated by the SANsymphony PowerShell script.
Scraping Metrics in Prometheus
After configuring the Windows Exporter to expose SANsymphony metrics, the next step is to configure Prometheus to scrape those metrics from the exporter's endpoint.
To download and set up Prometheus, visit Download- Prometheus.
Follow the below steps:
- Under the Prometheus section, download the Windows .zip file.
- Extract the .zip archive to a local directory and open the extracted folder.
-
Configure Prometheus to Scrape the SANsymphony metrics from Windows Exporter:
- In the extracted Prometheus folder, locate and open the prometheus.yml configuration file.
-
Add a new job under scrape_configs to define the Windows Exporter as a target:
CopyYAML
scrape_configs:
job_name: 'windows_exporter'
static_configs:
targets: ['<windows_exporter-ip>:9182']
- Replace <windows_exporter-ip> with the hostname or IP address of the system running the Windows Exporter. If Prometheus and the exporter are on the same system, use localhost.
- Start Prometheus Server:
- Open PowerShell or Command Prompt and navigate to the Prometheus directory.
-
Start the Prometheus server by running the following command: Copy
.\prometheus.exe --config.file=prometheus.yml - After the Prometheus server starts successfully, open a web browser.
- Access the Prometheus Web UI using one of the following URLs:
- Local system:
Copyhttp://localhost:9090
- Remote system (if hosted remotely):
Copy(Replace <your-prometheus-ip> with the actual IP address of the Prometheus server.)http://<your-prometheus-ip>:9090 - From the Prometheus UI, you can verify that SANsymphony metrics are being successfully scraped from the Windows Exporter. See Verifying SANsymphony Metrics in Prometheus.
Verifying SANsymphony Metrics in Prometheus
Before creating dashboards in Grafana, you can verify that SANsymphony metrics are being successfully collected by Prometheus using its built-in web UI. If you have not yet configured the PowerShell script and Windows Exporter, see Configure the PowerShell Script for SANsymphony Metrics to ensure Prometheus can scrape metrics successfully.
-
Open your Prometheus web UI in a browser:
Copy
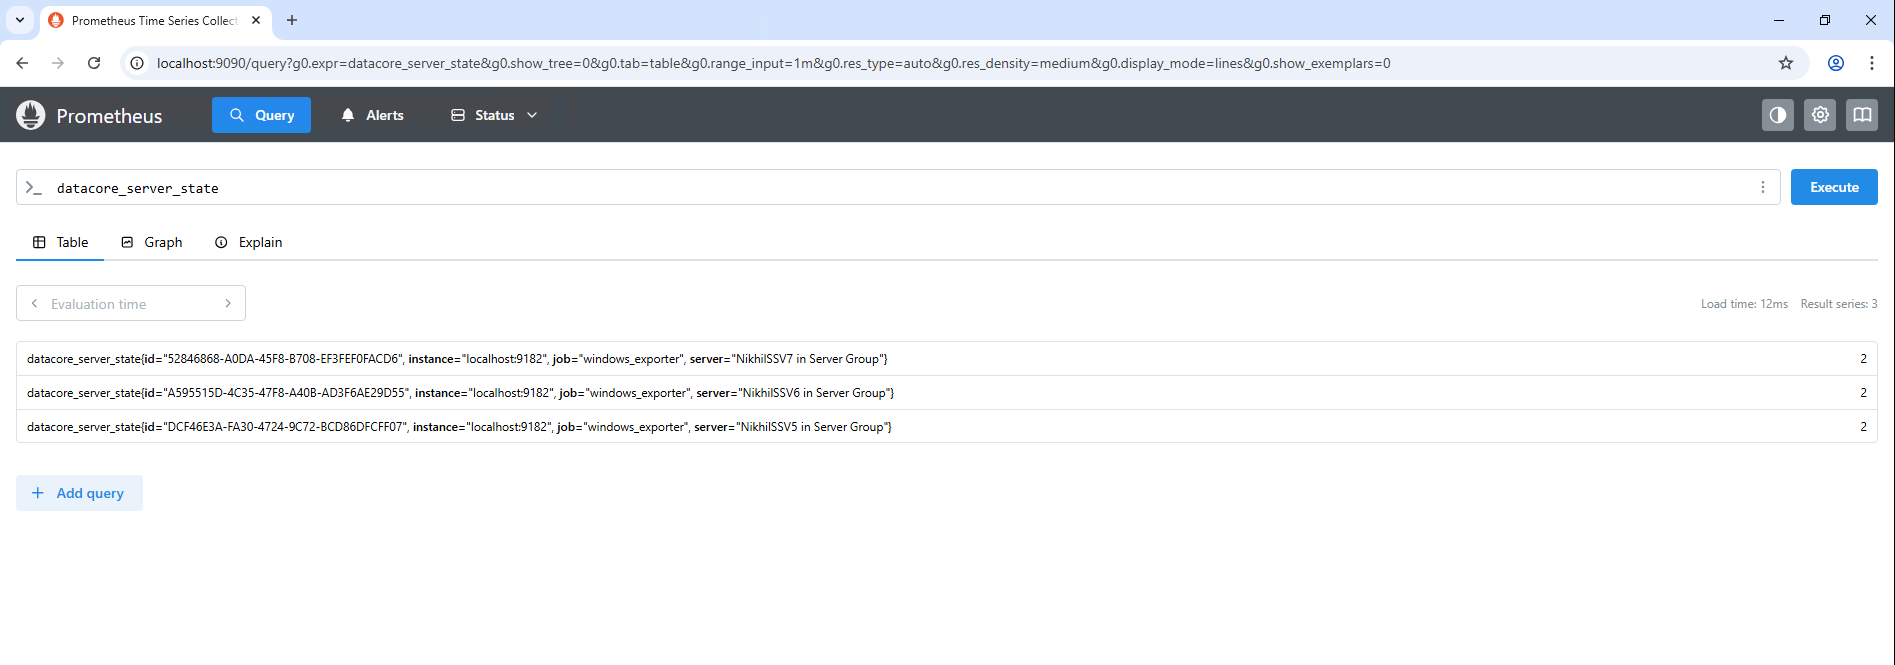
http://<your-prometheus-ip>:9090 - In the Query bar, enter a SANsymphony metric name(for example: datacore_server_state) and click Execute.
- The latest SANsymphony metric values should appear in the results section.
- The below image of Prometheus UI showing successfully collected SANsymphony metrics.
- This confirms that the DcsPrometheusMetrics.prom file was read by Windows Exporter, and the metrics were successfully scraped by Prometheus.
Visualizing SANsymphony Metrics in Grafana
Grafana connects to Prometheus and visualizes SANsymphony metrics through dashboards. This section explains how to access Grafana, add Prometheus as a data source, and begin creating or importing dashboards to display collected SANsymphony metrics.
To download Grafana, see Download Grafana | Grafana Labs.
- Open Grafana at http://<grafana-ip>:3000.
-
Log in using the default credentials:
- Username: admin
- Password: admin (you’ll be prompted to change it on first login).
-
Add Prometheus as a Data Source:
- In Grafana Data Sources, click Add data source.
- Select Prometheus from the list.
-
In the HTTP > URL field, enter your Prometheus endpoint:
Copy
<http://<your-prometheus-ip>>:9090 - Scroll to the bottom and click Save & Test to validate the connection.
- After successful connection, you can import or build dashboards using the collected SANsymphony Prometheus exposition metrics.
Learn More