Prometheus Exporter for DataCore SANsymphony
Explore this Page
Introduction
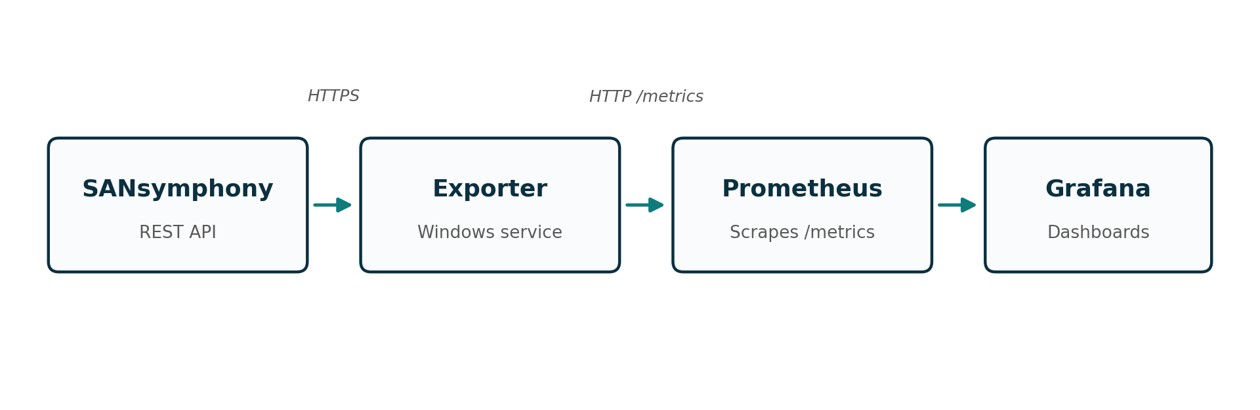
The DataCore SANsymphony Prometheus Exporter is a Windows service that collects metrics from a SANsymphony server group and publishes them in Prometheus format for scraping and visualization. It connects to the SANsymphony management server over the REST API, gathers topology, state, health, and performance data, and makes it available on an HTTP endpoint (/metrics, using port 9876 by default).
For more information about SANsymphony, refer to the official DataCore SANsymphony documentation.
This exporter replaces the previous PowerShell-based exporter. For information about the previous exporter, see Prometheus Exporter for DataCore SANsymphony. The new exporter runs as a Windows service and provides the /metrics endpoint directly. You no longer need the scheduled PowerShell script or the Windows Exporter textfile collector. This is a replacement, not an upgrade. The new exporter uses different metric names and labels (ssv_*). Existing dashboards, alerts, and PromQL queries created for the previous exporter are not compatible and must be recreated.
Architecture
On each Prometheus scrape, the exporter queries the SANsymphony REST API, converts the response into Prometheus metrics, and returns them. Grafana, which is optional, is used to visualize the collected metrics. The exporter can run on the SANsymphony server itself or on any other Windows computer that can reach it over the network.
How the Exporter Connects to SANsymphony
- Signs in once: The exporter signs in to the SANsymphony REST API and reuses that session for later requests, rather than signing in again on every scrape.
- Supports multi-node groups: The exporter automatically finds the other management servers in a group and switches to one of them if the server it is using becomes unreachable.
- Accepts self signed certificates: This is the default and can be changed, as described in Configuring Prometheus Exporter.
Collectors
Data is organized into three collectors:
| Collector | Reports |
|---|---|
| Inventory | Topology and state for the server group, servers, pools, virtual disks, hosts, ports, and physical disks. |
| Health | Monitor states and active alerts. |
| Performance | I/O counters and latency for servers, pools, virtual disks, hosts, ports, and physical disks. |
Each collector reports whether its own scrape succeeded, using the metrics ssv_up{collector} and ssv_scrape_duration_seconds{collector}. There is no single overall ssv_up metric. To check status across all collectors at once, use min(ssv_up) in your query.
How Often Data is Collected
- Always current: The exporter does not cache data between scrapes. Each scrape reflects the current state of SANsymphony, refreshed at whatever interval you configure in Prometheus. SANsymphony itself also holds a short internal cache of about 30 seconds.
- Time limit: Each scrape completes within 30 seconds. Performance data for multiple objects is collected at the same time (8 at once by default) to stay within that limit.
- Recommended interval: For large server groups, a scrape interval of 30 to 60 seconds is recommended.
Learn More