The Allocation View and Allocation Estimation tools provide different views of the allocation for disk pools.
o The Allocation View tool provides a view of allocation and storage temperature per physical disk and also per virtual disk in a pool.
o The Allocation Estimation tool provides a view of current pool size versus actual and projected storage depletion for a pool.
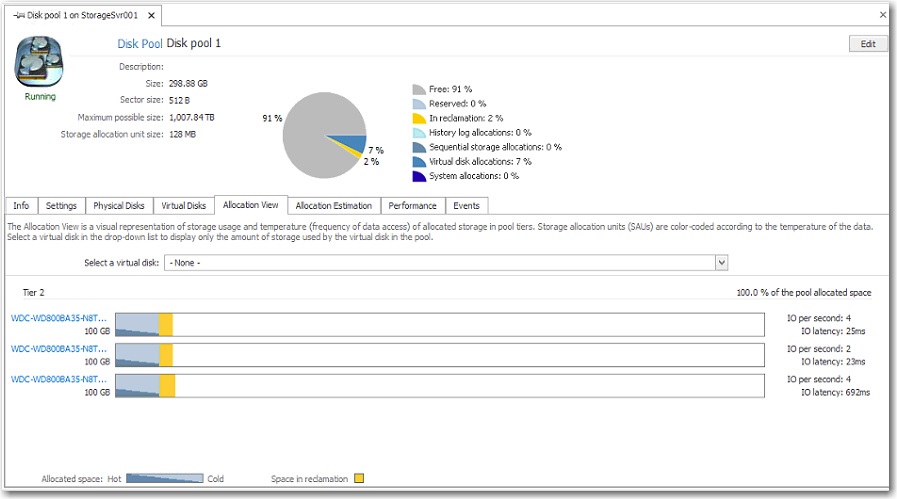
The Allocation View is a visual representation of storage usage and "temperature" of allocated storage in a pool. The temperature is based on the frequency of reads to the data, as well as writes too if write-aware auto-tiering is selected for a virtual disk created from the pool. The amount of storage used by a specific virtual disk in the pool can also be displayed.
All physical disks in the pool are displayed under the assigned tier. The percentage of total allocated pool space in each tier is displayed. When a virtual disk is selected, the percentage of space allocated for the virtual disk is displayed per tier.
Each physical disk is represented by a bar chart of the total size of the disk. Storage allocation units (SAUs) within each physical disk are color-coded according to the temperature of the data and are displayed in a gradient of color ranging from dark blue to light blue. Allocated space that is accessed most often—"hot spots"— are dark blue, and allocated space that is accessed least often—"cold spots"— are light blue. Data is sorted by temperature and displayed from hot to cold.
Disk space in reclamation is displayed in yellow. The color key is at the bottom of the tab. White space is the free space in the pool.
Real time measurements for I/Os per second and I/O latency are provided for each disk.
The disk name to the left of the bar chart is a link to open the details page for that physical disk.
![]() Notes:
Notes:
o The temperature of data is based on the frequency of read operations (by default) or read and write operations if the Write-aware auto-tiering setting is enabled in the storage profile for virtual disks. Automated Storage Tiering must be enabled for data to migrate according to temperature. See Automated Storage Tiering for more information.
o The data temperature for a mirrored virtual disk will often differ on the pools used as storage sources because read operations are not mirrored.
The Allocation View tool is
located in the Disk Pool Details page
under the Allocation View tab.
![]()
The amount of allocated space for a virtual disk can be displayed for each physical disk in the pool.
To view space used by a specific virtual disk:
1 In the Select a virtual disk box, click the arrow to access the pull-down menu.
2 In the list, select the virtual disk to display.
To reset the view to include all virtual disks:
In the Select a virtual disk box, choose -None- .
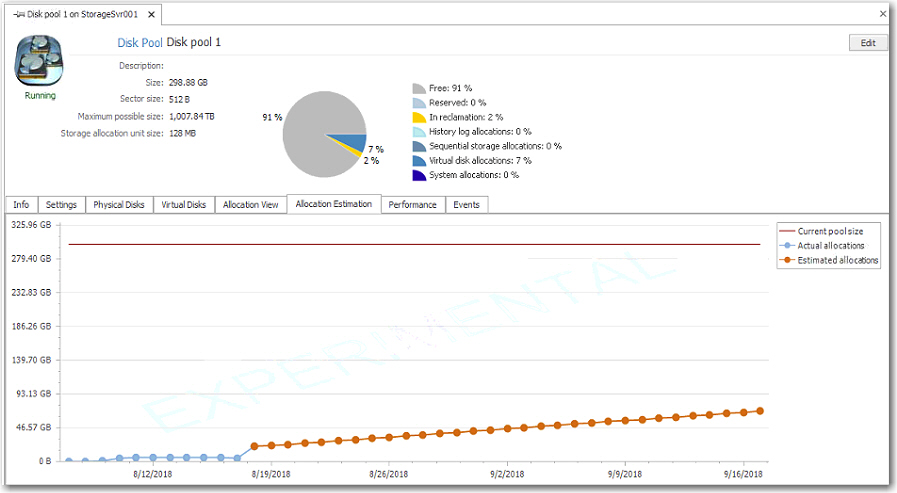
The Allocation Estimation tool is a graphical representation of the projected rate of storage depletion for a pool. The rate of pool allocations is monitored over time using disk pool performance counters to calculate the history of allocation and use it as the basis for the projected rate of future depletion. This tool is helpful in anticipating the need for additional storage requirements well in advance of depletion.
The graph includes color-coded lines for the following values:
o The actual history of allocations for the last 30 days. The graph will display the history of allocations since pool creation if created for less than 30 days,
o The predicted allocations for 30 days ahead. This is shown as a straight line on an approximate gradient which is calculated based on the past 30 days of actual allocations.
o The current pool size shown as a constant threshold.
The pool allocation depletion is predicted to occur at the time when the predicated allocations line intersects the current pool size threshold line in the graph. Hover over a data point in the graph to view the specific value for the point (date and amount of allocated space).
The associated pool depletion thresholds may be set to notify administrators when depletion is projected for a specific number of days. See System Health Thresholds.
Important Notes
o The Allocation Estimation tool is an experimental feature and is subject to change. This tool provides an estimate of the projected rate of pool depletion and is not a guarantee of the rate of pool depletion.
o The tool must be run at least three full days to start an estimation of pool depletion. During the first three days, the disk pool depletion is reported as being in an unknown state, after which the pool depletion rate starts to be calculated. Accuracy of the estimation is improved the longer the tool runs. Allow at least 30 days of data to get an accurate estimation.
o Data in the graph is refreshed every 10 minutes. Operations that effect the size of the pool (such as adding or removing disks) and virtual disk allocations will cause the estimate to re-adjust.
o Historical recording, an automatic recording of key performance data over time, is required for this tool to display data. If tool selections are unavailable and data is not displayed in the tool, Click the link at the top of the tab to re-enable historical recording. The link will only be displayed if historical recording was disabled. See Historical Performance Monitoring.
o The graph is not available if the pool is offline.
The Allocation Estimation tool
is located in the Disk Pool Details page
under the Allocation Estimation tab.
![]()