DataCore Management Console
In this topic:
Management console areas and elements
Management console concepts and features
Also see:
Name Resolution for using remote consoles
Connecting to a Server Group for instructions on opening the console.
About the Management Console
The SANsymphony Management Console is the main user interface for the software. The SANsymphony Management Console simplifies and centralizes configuration, storage allocation, and monitoring of SAN resources used to create, deliver and manage virtual disks for hosts. SAN resources include:/r/n- DataCore Servers/r/n- Hosts/r/n- Ports and I/O paths/r/n- Physical disks and pools/r/n- Virtual disks
Once two or more DataCore Servers are designated as being in the same server group, all configuration, operations and management operations in the console can be performed from either DataCore Server. The management console can also be run remotely from any computer with the SANsymphony Management Console component installed. Multiple server groups can also be managed from the same management console.
Management Console Areas and Elements
Areas of the console:
Elements of the console:
When the console opens for the first time:
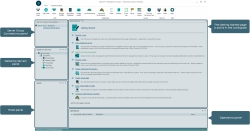
- The Server Group Connections Panel, DataCore Servers Panel and Hosts Panel are on the left, and the Getting Started page is the "active" page in the Workspace on the right. (The Alerts tool may be open in the workspace if there is an active alert when connecting for the first time.) The Operations Panel is under the Workspace on the right. The DataCore Servers Panel will show all the SAN components of the DataCore Server connected to.
An example of the Initial view of the SANsymphony Management Console after installation:
- The Home tab is active in the Ribbon. Also accessible in the> Ribbon is the Common Actions tab, from which basic operations can be initiated.
- The Status bar at the bottom of the console is used to display connection status (Connected or Disconnected) between the SANsymphony Management Console and the DataCore Server. A red alert flag used for high priority notifications is located on the right.
Areas in the SANsymphony Management Console can be rearranged.
Ribbon
The Ribbon is a command bar that contains task-oriented tabs. Within each tab are command buttons organized in logical groups to perform related activities. Command buttons are found exclusively in the Ribbon.
There are two types of tabs in the Ribbon:
- Permanent tabs provide command buttons that will be used regularly and are always available.
- The Home tab is comprised of the following groups:
- The Lists group provides buttons to display general information for all objects in the same category, such as listings of all virtual disks, all disk pools, all hosts, all users, and all storage profiles.
- The Diagnostics group provides buttons to open tools used to monitor and troubleshoot the system, such as System Health, Live Performance, Recorded Performance, Tasks, Reports, Event Log, and Alerts.
- The Layout group provides buttons to open panels and the Getting Started page after they are closed. Reset Layout button in this group closes all active tabs, repositions all panels and shows the Getting Started page if the Show this page at startup check box is selected.
- Help is used to open the SANsymphony online help, which is applicable to the latest released version of the software.
- The Common Actions tab is comprised of activities that will performed often, such as creating and serving virtual disks, creating disk pools, registering hosts and users, assigning port roles and groups, or connecting to a server group. There is also a button to refresh the console in this tab.
- The Home tab is comprised of the following groups:
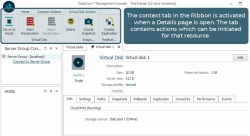
- Context tabs provide command buttons that are relevant to the object of the details page or tool that is open in the workspace. (Details pages will be discussed later.) When a details page is opened, the context tab is accessible in the Ribbon. When the page is closed, the context tab will disappear.
Panels
There are four panels in the console: Server Group Connections Panel, DataCore Servers Panel, Hosts Panel, and Operations Panel. Panels can be closed by clicking on the X and re-opened from the Ribbon>Home tab.
Server Group Connections Panel
The Server Group Connections Panel provides a tree view of the connections made locally per user. This is useful when connecting to different server groups. When a user logs in and opens the SANsymphony Management Console, all the connections saved for that user on the same machine will be displayed in the panel in the management console.
The connections are listed by server group, then DataCore Server.
See Connecting to a Server Group for more information.
DataCore Servers Panel
The DataCore Servers Panel provides a tree view of the SAN components (or resources) of DataCore Servers and server groups. SAN components are organized under categories in the tree. When the categories are expanded the individual components are listed. A single click on a component will open the details page for that component.
This panel provides an "inventory" of the following components for DataCore Servers in the local server group:
- Physical Disks lists unallocated disks and unallocated partitions on disks on the DataCore Server. The amount of available free space on each disk is displayed.
- DataCore Disks lists all virtual disks that have been served to that DataCore Server. (See DataCore Disks.)
- Virtual Disks lists all virtual disks created using storage from the DataCore Server.
- Disk Pools lists disk pools created on the DataCore Server and the disks added to the pools.
- Server Ports lists all Fibre Channel and iSCSI ports for the DataCore Server. The port role is also displayed.
Hosts Panel
The Hosts Panel provides a tree view of the SAN components of hosts, including host groups. VMware vCenters are also displayed after they are registered. Components are organized under categories in the tree. When the categories are expanded the individual components are listed. A single click on a component will open the details page for that component.
This panel provides an "inventory" of the following components for registered hosts and VMware vCenters:
- Virtual Disks lists virtual disks served to the host.
- Host Ports lists the ports assigned to the host.
- When a main component in the console tree is clicked, the corresponding server or host details page will open to the tab of the component which is clicked. This only applies when the server or host details page is not already open to a different tab. For instance, if Virtual Disks is clicked in the DataCore Servers Panel, the server details page will open to the DataCore Server Details page> Virtual Disks tab.
- The Collapse All operation is available in the panels and virtual disk lists by right-clicking on a main component in the console tree and selecting it in the context menu. This operation will collapse the selected component and all sub-folders under that component in the tree. For items that are collapsible but do not have sub-items, the Collapse All operation is disabled.
- The Ctl+F shortcut opens a Search box at the top of the panels where search criteria can be entered.
Icons in the DataCore Servers Panel and Hosts Panel are provided as a means of identification and to show warning or error conditions. Refer to Panel Icons for descriptions.
Operations Panel
The Operations Panel displays a running list of user-initiated actions and the status of the operation. Each operation is listed with a timestamp indicating the start time. Running operations are visible in all open consoles connected to the server group. Operation progress and status is provided—even for operations that run asynchronously and generally take a longer time to complete. Some examples of asynchronous operations are creating a support bundle, virtual disk reclamation, some snapshot and rollback operations, and most replication operations. When the operation is complete the status will display Done. If an operation is canceled, the status will display Canceled.h
The panel will appear when the first operation is performed. Actions are listed from earliest at the top to most recent at the bottom. Up to 100 operations will be listed. When the management console is closed, the list of operations is cleared.
Workspace
The workspace is the area where all lists and details pages are viewed and actions are performed using wizards or dialog boxes.
When a list, details page, wizard or dialog box is opened a corresponding tab is created at the top of the workspace for identification. Multiple pages can remain open, but only one page can be active at a time.
To bring a page from the background to the foreground, click on the tab.
To close a page and remove it from the workspace, click the X on the tab. (Details pages must be pinned and then can be closed.)
Re-arranging Areas in the Management Console
The management console can be configured to display and arrange the panels and workspace to best fit your needs:
- The thumbtack icon is used to "pin" the panel when the pin is positioned vertically. To save screen space, unpin the panel, it will auto-hide the panel when the mouse pointer is moved away, leaving a vertical tab. To show the hidden window, use the mouse to hover over the tab.
- To reposition the panels, pin the panel, then click on the panel title and drag the panel. Without releasing the mouse, stop dragging the panel for a moment and panel "dockers" will appear. After the dockers appear, move the mouse pointer over the docker displaying the desired position. When the area is highlighted, release the mouse pointer and the panel will move to the new position.
- Panels can be closed by clicking on the X in the panel title. To open panels, click the appropriate button in the Home tab in the Ribbon.
Changes to the layout will be preserved when the management console is closed.
Getting Started Page
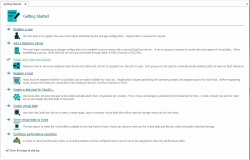
The Getting Started page provides links to perform basic initial configuration steps. Initially links are displayed in blue with an arrow to indicate that they have not been completed. After the step is performed, the link is displayed in green with a check mark.
By default, this page is displayed when the management console is opened. After the initial configuration is complete and the page is no longer needed, it can be closed by clearing the Show this page at startup check box at the bottom of the page. To open this page after it is closed click Getting Started in Ribbon>Home tab.
Also see Getting Started for more detailed instructions to assist in the configuration.
Details Pages
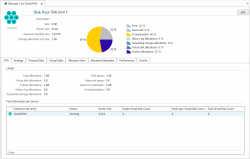
Every object listed in the DataCore Servers Panel or Hosts Panel, and each registered SANsymphony user, configured task, storage profile, and template has a page of detailed information that is specific to the object.
All details pages work in the same manner:
- Status of the object is provided at the top of the page under the icon. Status is color coded according to severity: green (healthy), orange (warning) or red (critical).
- Some information can be changed at the top of the page. Click Edit, make changes, and then click Done.
- Information is categorized under tabs in the page. The same selected tab is recalled for the same object types. For example, when a DataCore Server Details page is opened to the Virtual Disks tab and the detail page for other servers are opened, the Virtual Disks tab is the active tab. When a different tab is selected, then that tab is the active tab.
- When information is listed in a tab, actions can often be performed from context menus revealed by right-clicking on an object in the list.
- Convenient links to perform actions may also be provided in the tabs.
- When a details page is active, a context tab is revealed in the Ribbon to perform actions on the object.
- When a details page is active and any other page is opened, the details page will close unless it is pinned by clicking the thumbtack
 on the tab. Pinned pages stay open until manually closed.
 - Column manipulation and customization in lists provides convenient display for large configurations.
To open the details page:
- From a panel, click the listed object.
- From a list, double-click the object. Alternatively, right-click on the object and choose View Details from the context menu.
- Details pages for users can be opened from the Users List and tasks can be opened from the Tasks tool.
When the SANsymphony Management Console is closed, all details page that were open will be saved and reloaded again when the console is re-opened as long as the same user is logged on.
Lists
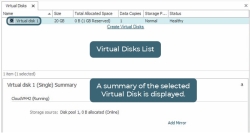
Lists are used to provide a quick accounting of general information for related SAN resources. Lists are provided for a global view of specific objects such as the virtual disks, disk pools, hosts, storage profiles, and virtual disk templates. These lists are opened in the Home tab in the Ribbon.
Information is also provided in lists on the tabs of details pages.
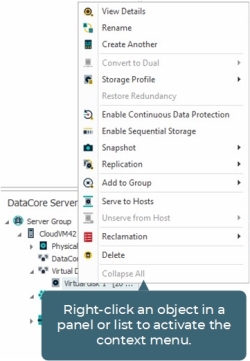
Most lists have context menus which appear when a listed object is pointed to with the mouse and a "right-click" is performed. The context menu is relevant to the selected object.
Column manipulation and customization provides convenient display for large configurations:
- A context menu is available by right-clicking on the column header.
- Columns in the tabs can be sorted by multiple columns. For instance, sort the Size column and then the Storage Profile column to sort first by size, then by profile. This feature is available by context menu selection or by clicking on the column and using the arrows to sort in ascending or descending order.
- Columns can be re-arranged by dragging them to the desired position.
- Columns can be resized to "best fit".
- The Column Chooser displays a list of available columns that can be dragged into the tab. Columns that exist in the tab can be removed by dragging them into the Column Chooser. Changes remain until the details page is closed.
- The operation Collapse All will collapse the selected virtual disk or virtual disk group and all associated virtual disks (including snapshots and rollbacks) under that virtual disk in the tree. The operation will only be visible if there are items that can be collapsed in the tree.
- The Ctl+F shortcut opens a Search box at the top of the list where search criteria can be entered.
- Enter the string to search for in the box and click Find. The items not matching the criteria are filtered out of the list and the matching criteria strings are highlighted.
- Click Clear to clear the box and return all items to the list.
- Click x to close the Search box.
Wizards, Dialog Boxes and Tools
Wizards, dialog boxes, and tools are supplied to assist in performing actions. These management console elements are addressed in detail from Help topics that address the functions that they serve and will not be discussed here. See the Welcome topic or the Table of Contents for a full list of topics.
Management Console Concepts and Features
DataCore Software recognizes that importance of providing a flexible management console that fits different scenarios and eliminates unnecessary steps. The comprehensive SANsymphony Management Console allows the same activities to be performed in various ways and from different areas in the management console to suit your preferred work habits.
When the console is closed, tabs that were open in the console workspace are remembered and will be re-opened when the console is re-opened.
The same actions that can be performed from the Ribbon are also available from context menus that are available from the panels and lists throughout the management console.
The SANsymphony Management Console provides:
- Advanced view of the information in the console.
- Context menus to perform operations from panels and lists
- Context tabs that appear in the Ribbon to perform operations relevant to an active details page
- Links to perform additional activities "on-the-fly" if needed
- Drag-and-drop capabilities for some operations
- Multiple selections from lists
- The Delete key will delete an object selected in a list. For example, in the Virtual Disks List, select a virtual disk and click Delete.
- Copy capabilities
- Label and content from forms in the management console can be copied to the clipboard. Point to the text in the form, depress the Ctrl key and right-click the mouse, then paste in a text file. For example:
- Serial number and unique identifier for a physical disk can be copied from the Physical Disk Details page.
- IQN, MAC address, chipset and firmware revisions, and driver version can be copied from the iSCSI Port Details page.
- CPU information can be copied from the DataCore Server Details page.
- Message text from event logs and alerts in the console can be copied to the clipboard by selecting the message in the list, then select the message text in the details area at the bottom of the page and click Copy from the context menu. Paste to a text file.
- Label and content from forms in the management console can be copied to the clipboard. Point to the text in the form, depress the Ctrl key and right-click the mouse, then paste in a text file. For example:
- Timestamps in the console are modified accordingly when the system time zone of the computer running the console is changed. This allows users in different time zones to view timestamps in their current time zone instead of the local time zone of DataCore Servers. For instance, time zone changes will update timestamps in the Operations Panel, Event Log, System Health, Performance tool, Tasks tool (scheduled time trigger, last start and stop times), snapshot points, rollback restore points, and support bundle folder path.
Exceptions follow:
- Timestamps in a rollback or snapshot name are displayed in UTC (Coordinated Universal Time).
- Timestamps within the support bundle files are displayed in UTC.
Advanced View
The Advanced View allows administrators to optionally view more detailed information in various object details pages and lists in the console. The Advanced View contains the same information displayed in the default view plus additional information that may be useful to some administrators who want a more expanded set of information about the server group configuration.
The console view can be quickly toggled between default and Advanced View using the key combination Ctrl + Shift + a.
Advanced View can also be turned on and off in the Ribbon>Home tab under the Layout section, click Turn On Advanced View or Turn Off Advanced View.
Context Menus
The SANsymphony Management Console provides handy context menus that can be invoked from panels and lists by "right-clicking" on the object with the mouse. Context menus are only relevant to the particular object from which they are invoked. An example of a context menu accessed from a virtual disk:
To demonstrate how to use context menus, let's take the example of serving virtual disks to a host.
This action requires two pieces of information: the host and the virtual disks to serve.
If you right-click on a host in the Hosts Panel and select Serve Virtual Disks from the menu, we assume that you want to serve virtual disks to the selected host. The selection of the host is implied.
The remaining selection needed to complete the process would be to select the virtual disks to serve, so the Select Virtual Disk dialog box would open allowing you to choose the virtual disks.
Alternately, the same task could be initiated from the Virtual Disks List or DataCore Servers Panel. If you right-click a specific virtual disk in the list or panel and select Serve to Host, the choice of the virtual disk is implied and the Select Host dialog box would open.
This type of implied selection method from context menus exists throughout the management console.
Context Ribbon Tabs
Specialized context tabs may appear in the Ribbon when certain dialog boxes, tools, or details pages are active in the workspace. The context tab remains active as long as the object is active. For instance, when a specific Virtual Disk Details Page is active, the Virtual Disk Actions tab appears in the Ribbon with all applicable command buttons to perform actions on the selected virtual disk.
Disabled command buttons are due to the property of the objects. For example, if the Virtual Disk Details page is active for a mirrored virtual disk, then the option to Add Mirror will be disabled because it is not applicable.
On-the-fly Operations
Many links are provided to perform related activities in wizards or dialog boxes.
For example, here are some on-the-fly operations that can be performed:
- Disk pools can be created from the Create Virtual Disk wizard.
- Virtual disks can be created from the Serve to Host wizard.
- Hosts can be registered from the Serve to Host wizard.
- Virtual disks can be created from the Virtual Disks List.
- Hosts can be registered from the Hosts List.
Drag-and-Drop Capability
Certain operations can be performed quickly by dragging SAN resources from one area of the management console to another area. Drag-and-drop capabilities may be performed from panels and lists.
Examples:
- In the Live Performance, counters can be added by dragging the component from the DataCore Servers Panel or Hosts Panel onto the graph area of the tool.
- In the Virtual Disks List or from any Virtual Disks tab on a details page, virtual disks can be served by dragging a virtual disk to the Hosts Panel and dropping it onto the host or onto a specific host port.
- In the DataCore Servers Panel, virtual disks can be served by dragging them to hosts in the Hosts Panel, even to specific host ports.
- In the DataCore Servers Panel, physical disks can be added to pools by dragging them from the Physical Disks to the disk pool under Disk Pools.
- In the Hosts List, individual hosts can be added to groups by dragging them into the group.
Multiple Selections
Operations can be performed on multiple items in lists. When multiple items are selected, only operations that can be performed on all selected items will be enabled. For instance, if you select several virtual disks in a list, some with CDP enabled and some not, the Enable Continuous Data Protection option will be disabled.
