System Health Tool
System Health provides a system
wide performance view of SAN resources in the server group.
System Health provides:
o Status of managed resources
requiring attention
o Bandwidth measurements
of ports, disk pools and physical disks
o Storage capacity breakdowns
o Performance Spotlight
which shows key performance statistics for virtual disks
To open System Health:
In the Ribbon>Home tab, click
System Health in the Diagnostics
area.
Also see:
System
Health Thresholds
Status
The Status
tab in System Health tool provides a quick visual summary of the overall
health of
managed by SANsymphony
software. Internal system monitors report events when status changes for
a managed resource. Events occurring in the SAN are classified by severity,
and reported in the tool. Status of a resource is presented in a single
message and is displayed according to the severity; higher severities
are displayed before lesser severities. At a glance, any managed
resource requiring attention can be identified in the tool. Double-click
on a message in the list to view details of the object. This tool can
be kept open and active in your workspace to continually monitor the health
of your SAN resources.
Physical disks with
(also known as SMART) implementation are monitored for predicted drive
failure.
Security Classifications (highest to lowest):

|
Critical. This resource has received a status which is unhealthy
and requires immediate
attention. |

|
Warning. This resource has received a status which requires
attention. Check this resource and take action to ensure it does
not reach a critical status. |

|
Attention. This resource may require attention. Verify the
status condition. |
Each message may contain multiple reports containing different severity
classifications; the message will be displayed under the highest severity
classification. For instance, If a Fibre Channel port is Not-connected
(Attention severity) and the Loop/Link is down (Critical severity), then
this message is reported under the Critical classification at the top
of the list.
System Health messages are displayed as long as they are valid. If the
System Health tool is open and no messages are displayed, then all managed
resources are healthy.
 Link errors have to
be manually reset in order to remove them from System Health. See Resetting
Link Error Counts.
Link errors have to
be manually reset in order to remove them from System Health. See Resetting
Link Error Counts.
Bandwidth
The Bandwidth tab in System
Health provides measurements associated with bandwidth to provide an overall
view of network traffic. This tab can be used to identify specific SAN
resources using excessive bandwidth. Measurements are provided for all
front-end and mirror ports, disk pools, and physical disks for each DataCore Server in the server
group. Data is refreshed frequently. Throughput, latency, and I/Os per
second for each SAN resource is provided in real time.
Expand the objects in the tree to view all measurements for the DataCore Server. Comparatively
high latency figures for a SAN resource may indicate potential network
issue and identify where to begin troubleshooting in the server group
when a bottleneck is suspected.
Bandwidth Measurements:
o Throughput
· Front-end
Throughput =
Amount of data received by the target
port.
· Mirror
Throughput = Amount of data received by the mirror target port. (Data sent by a port as an initiator
is not counted.)
· Back-end
Throughput = Amount of data sent
by the initiator port.
· Physical
Disk Throughput = Time of I/O completion. This is on the Initiator
end and includes the transfer layer time.
· Disk Pool
Throughput = Time of I/O completion.
o Latency is the largest delay in data transmission
and displayed in milliseconds.
o IO/s
(IOs per second) is the average number of read
and write operations performed.
Storage
The Storage tab in System Health
provides pie charts for a quick visual representation of the storage in
the server group. The Licensed
Storage Capacity pie chart represents the regular (non-bulk)
storage in the group. The Licensed
Bulk Storage Capacity pie chart is displayed when there is
bulk storage licensed in the group. See
Server Group Details for server
group licensing.
Licensed Storage Capacity
Licensed Storage Capacity is
the amount of storage that is licensed for the server group. Licensed
storage capacity includes allocated, free, and unconfigured storage. DataCore Disks
are not included in the Licensed
Storage Capacity view.
Total Storage Capacity is the
amount of storage that is licensed for the server group including
DataCore Disks.
Total storage capacity includes allocated, free, unconfigured, and DataCore Disks (allocated
and free). To view the total storage
capacity, select the Show
DataCore Disks
check box in the Storage tab.
The following storage categories can be displayed
in the Licensed Storage Capacity pie chart:
The different storage
categories displayed in the pie chart are calculated and displayed as
a percentage of the entire amount. Percentages are rounded to the nearest
whole percent. A category must be at least 1% of the whole in order to
be displayed in the pie chart. The different categories of storage
are color-coded in a key next to the chart.
o Allocated storage is the amount
of physical storage that is currently in use. This includes storage allocation
units (SAUs) that have been allocated from disk pools and used by pass-through
disks that are being managed by the software.
o DataCore Disks
- Free is the amount of storage in DataCore Disks
that is not allocated.*
o DataCore Disks - Allocated
is the amount of storage in DataCore Disks
that is currently in use as storage.*
*DataCore Disks
are virtual disks created by DataCore Servers
and served to DataCore Servers
in the same server group where they may be used as storage. This category
will only be displayed in the Total storage
capacity view of the chart when the Show
DataCore Disks
check box has been selected.
o Expansion
limit is the percentage in use (allocated and free) of the
maximum amount of licensed storage for the server group at the current
license level.
o Free storage is the amount of storage
that has been added to pools and is available for use, but not allocated.
o Unconfigured storage is the difference
between the amount of licensed storage and the amount of storage that
is currently configured (allocated and free storage) in disk pools and
pass-through disks. For instance, if the licensed storage capacity
is 10 TB and the amount of configured storage (allocated and free) is
2 TB, the unconfigured storage would be 8 TB.
Licensed Bulk Storage Capacity
The following storage categories can be displayed
in the Licensed Bulk Storage Capacity pie chart:
The different storage
categories displayed in the pie chart are calculated and displayed as
a percentage of the entire amount. Percentages are rounded to the nearest
whole percent. A category must be at least 1% of the whole in order to
be displayed in the pie chart. The different categories of storage are
color-coded in a key next to the chart. (Bulk storage has no expansion
limit.)
o Allocated storage is the amount
of physical bulk storage that is currently in use. This includes storage
allocation units (SAUs) that have been allocated from bulk disk pools
that are being managed by the software.
o Free storage is the amount of storage
that has been added to bulk disk pools and is available for use, but not
allocated.
o Unconfigured storage is the
difference between the amount of licensed storage and the amount of storage
that is currently configured (allocated and free storage) in disk pools.
For instance, if the licensed storage capacity is 10 TB and the amount
of configured storage (allocated and free) is 2 TB, the unconfigured storage
would be 8 TB.
Performance Spotlight
The Performance Spotlight feature displays key performance statistics
for the top 20 virtual disks in the server group experiencing the highest
workload. This tool enables an administrator to quickly view the virtual
disks with the highest workload in order to identify potential problems,
investigate the cause, and intervene before performance degradation is
noticeable.
A sampling of performance counter data is collected by the software
per virtual disk in two minute intervals over time so that averages of
the historical data can be calculated for a selected time period. Counter
data is calculated and presented in three performance statistics intended
to alert administrators to possible traffic bottlenecks in the configuration:
Average Latency (ms), Average Bytes Transferred/sec, and Average Operations/sec.
The Performance Spotlight statistics are presented in bar
chart and table views. Data displayed in
the tool can be retrieved based on any one of the
and can be sorted by any one of these statistics. For example, data can
be retrieved for the top 20 virtual disks with the highest average latency,
but be sorted by the virtual disks that have the highest average number
of bytes transferred per second.
Data can be displayed for the last seven, 30, or 90 days in order to
see the values for the same data in a progression over time. Data for
a selected time period can also be exported to a CSV (comma-separated
value) file for use with other applications.
Performance Spotlight Statistics
These statistics are derived by DataCore
performance counters:
o Average Latency in milliseconds
- the sum of the time spent servicing read and write requests during the
selected time period for a given virtual disk, divided by the total number
of read and write requests made during that time period.
The calculation is based on the performance of all the individual paths
of the virtual disk. The time spent servicing read and write requests
is calculated by adding all values for the TotalReadTime and TotalWriteTime
counters for each path* during the selected time period. The total number
of read and write requests is calculated by adding all values for TotalReads
and TotalWrites counters during the selected time period.
The value displayed per host in the table view shows the average latency
for a given path between a host and a virtual disk.
o Average
Bytes Transferred per second - the sum of all read and write data
bytes during the selected time period for a given virtual disk, divided
by the number of seconds in that time period.
The calculation is based on the performance of all the individual paths
of the virtual disk. The sum of the data bytes is calculated by adding
all values for the TotalBytesRead and TotalBytesWritten counters for each
path* during the selected time period.
o Average
Operations per second - the sum of all read and write requests
during the selected time period for a given virtual disk, divided by the
number of seconds in that time period.
The calculation is based on the performance of all the individual paths
of the virtual disk. The sum of the read and write requests is calculated
by adding all values for the TotalReads and TotalWrites counters for each
path* during the selected time period.
*A path is a mapping between an initiator and target port of a logical
disk (virtual disk storage source) on a server, In Live
Performance, the paths are defined as virtual logical units and are
identified by the initiator port, target port, and LUN.
Important Notes:
o Counter
data is sampled at two minute intervals. Calculations are based on the
sampled data over the course of the selected time period.
o The statistics in the
tool are based on the performance metrics of the individual paths of the
virtual disk and only take into consideration virtual disks that are currently
served to hosts. Snapshots, rollbacks, and virtual disks served
via loopback ports and to other DataCore Servers
are also taken into consideration.
o The top 20 virtual
disks that appear in the tool are chosen based on the selected statistic
(Average Latency (ms), Average Bytes Transferred/sec or Average Operations/sec).
o When data is incomplete
for a virtual disk in the selected time period, the actual data for that
time period will be displayed. Data could be incomplete if a virtual disk
has been served to a host for less than the selected time period, or if
paths have been in existence for less than the selected time period. For
example, if the selected time period is Last
7 days and a virtual disk was served to a host for two days of
that time period, the statistic will be calculated using only the data
that is available, but averaged over the entire time period of seven days.
The names of virtual disks with incomplete data for the selected time
period are displayed in italics. Names and data can be displayed in a
tool tip when the virtual disk is pointed to by the mouse.
o Virtual disks with
no performance data will not have values displayed. This is most like
likely to occur when a virtual disk has just been served to a host and
performance data has not yet been recorded.
o Data in the tool is
automatically updated every six hours, to manually refresh data, click
Refresh in the System
Health Actions tab in the Ribbon.
o Historical recording,
an automatic recording of key performance data over time, is required
for this tool to display data. If tool selections are unavailable and
data is not displayed in the tool, click the link at the top of the tab
to re-enable historical recording. The
link will only be displayed if historical recording is disabled.
See Historical Performance
Monitoring.
Chart View
The chart view is a graphical presentation of the three Performance
Spotlight statistics in individual bar charts.
The statistic that is used to select the top 20 virtual disks is selected
in the chart view. The set of virtual disks in all charts are the same,
selected by the statistic. The top chart displayed in the tool is the
chart for the selected statistic. Each bar in the chart represents a virtual
disk. Charts for the two statistics not
selected are displayed under the top chart. The bottom charts are in alignment
with the top chart so that the bars representing the same virtual disks
are always in the same alignment. In this manner, all statistics for the
same virtual disk can be viewed in the tab by scrolling up and down. By
default, data for the top 20 virtual disks selected by the highest Average
Latency is displayed. Virtual disks are color-coded according to the key
at the top of the chart.
By default, the virtual disks are sorted by the selected statistic,
but the set of virtual disks can be sorted by any one of the statistics
provided in the tool. The bars representing the virtual disks in each chart will be ordered according
to the selected sorting statistic from left to right. The virtual disks
in all three charts are always in alignment based on the selected sort
order.
A tool tip defines the statistic when the mouse is hovered over a bar
in the chart. The tool tip identifies the virtual disk and the specific
value for the statistic. If the virtual disk name appears in italics,
data is incomplete for the selected time period.
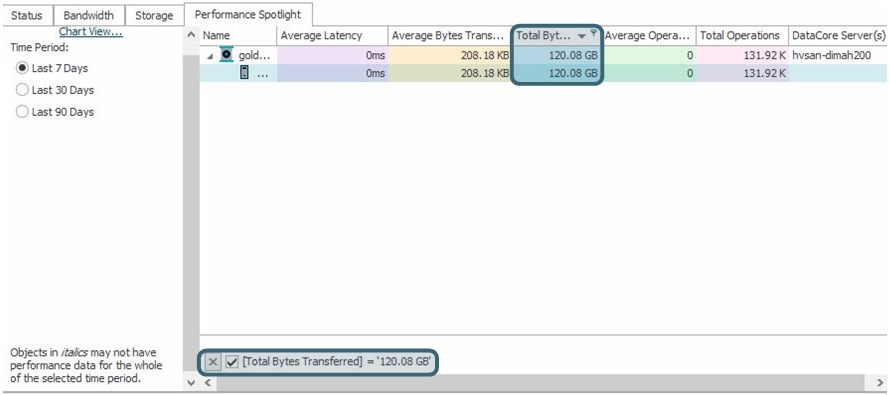
Table View
The table view provides more detailed information and presents performance
statistics for all served virtual
disks in the server group in a table format. Under each virtual disk are
individual values per host. The value displayed per host in the table
view shows the statistics for paths between the host and the virtual disk.
In addition, DataCore Servers
owning the storage sources in each virtual disk are listed in the table
for convenience.
Columns in the table are sortable. By default, column data is sorted
by Average Latency from highest to lowest values, but data can be sorted
by any column so that administrators can quickly determine virtual disks
with the highest values in order to troubleshoot performance issues. Data
is sorted by one column at a time.
Column cells are color-coded, to match the bar chart, with highest values
having the darkest color to quickly determine the highest values in the
list.
A tool tip defines the statistic when the mouse is hovered over the
heading in the table.
To sort data in columns:
o The arrow
indicates the column by which the table has been sorted. Click the column
header to change the column by which the table is sorted,
o A down-pointing arrow
means that values are sorted from high to low. An up-pointing arrow means
that values are sorted from low to high. Change the arrow direction by
clicking again in the column header.
To filter data in columns:
o The funnel symbol in
the column header removes all data that does not meet the selected value.
Multiple columns can be simultaneously filtered to exclude data that does
not meet all selected values. To select a value, focus the mouse in a
column and click the funnel symbol, then select the value from the drop-down
menu. Active filters are displayed at the bottom of the table and can
be disabled by clearing the check box or removed by clicking X.

Selecting Tool Options
All tool selections appear on the left side of the tab.
o The top
20 virtual disks to display and the sort order can be selected in the
Chart view by clicking a radio
button to the left of the charts.
o The time period to
display can be selected in either view by clicking a radio button on the
left side of the tab.
o The view can be toggled
between Chart and Table view by clicking the link Table
View or Chart View in
the upper-left corner of the tab.
Exporting Data to a CSV File
The data currently displayed in the list view of the tool can be exported.
This includes all virtual disk data and data displayed per host. Virtual
Disk IDs and Host IDs are also included.
To export data to a CSV file:
1 In the
Performance Spotlight, select
the time period for the data desired in the CSV file.
2 In the System
Health Actions tab in the Ribbon,
click Export to CSV.
3 In the Save
As dialog box, browse to the folder where the file should be saved.
Keep the default name provided in the dialog box or enter a different
file name.
4 Click
Save to save the data
to a file.