Using the DataCore Predefined Logstash Configuration File
Explore this Page
Overview
This section explains how to use the provided Logstash configuration file to forward SANsymphony syslog messages to third‑party platforms such as Elastic Search and Splunk. It covers placing and customizing the configuration file, configuring output destinations, opening the necessary ports, and running Logstash for proper log processing. It also provides guidance on verifying syslog forwarding and viewing logs in Elastic Search and Splunk for monitoring and analysis.
Using the DataCore Predefined Logstash Configuration File with Logstash
This section provides step‑by‑step instructions for placing, customizing, and running the DataCore‑provided Logstash configuration file. It walks you through updating inputs and outputs, opening required ports, and executing Logstash to process and forward SANsymphony syslog messages for indexing and visualization in Elastic Search or Splunk.
Follow these steps to place, customize, and run the configuration file for proper log forwarding and visualization.
- Copy or place the selected configuration file into the Logstash configuration directory, example:
- Confirm that the UDP port used in the configuration file (default is 514) is open and allowed through the firewall on the Logstash server. You can also specify new Port in RFC configuration file and in SANsymphony Syslog Settings based on your firewall connections.
- Open a command prompt on the Logstash server, navigate to the Logstash bin directory, for example:
- Customize the file as needed by updating input parameters and destination details for syslog message forwarding.
- In the output section of the configuration file, specify where to forward the parsed syslog messages. To forward logs to Elastic Search, provide the following:
- hosts: IP address and port of the Elastic Search server.
- index: Destination index name (example: syslog_5424).
- user and password: Valid credentials to authenticate with Elastic Search.
After setting up Elastic Search output, make sure to create an index pattern in Elastic Search that matches the index name (example: syslog_5424) to visualize data.
- If needed, you can also forward the same syslog messages to Splunk by adding a udp output block. For this, specify:
- host: IP address of the Splunk server.
- port: UDP port configured in Splunk to receive syslog messages.
- stdout { codec => rubydebug }: Outputs messages to the console for verification.
- Example configuration snippet (RFC5424 format):CopyScript
# output: where to send this data
output {

  # Send to Elastic Stack (Elastic Search)
  elasticsearch {
      hosts => "ELASTIC SEARCH_IP"
      index => "syslog_5424"
      user => "elastic"
      manage_template => false
  }

  # Simultaneously forward to Splunk via UDP
  udp {
      host => "SPLUNK_IP"
      port => 5140
  }

  # Local output for debugging
  stdout { codec => rubydebug }
}
The Elastic Search output sends SANsymphony syslog messages to the Elastic Stack (Elastic Search and Kibana) for indexing and visualization. The optional udp block forwards the same messages to Splunk, where the host specifies the IP address of the Splunk server, and port defines the UDP port that receives syslog messages.
- In the output section of the configuration file, specify where to forward the parsed syslog messages. To forward logs to Elastic Search, provide the following:
- Save the updated configuration file before running Logstash to ensure changes are applied.
- Make sure UDP port 514 is open on the Logstash server firewall to receive syslog messages from SANsymphony.
By default, UDP port 514 is specified in both the DataCore-provided Logstash configuration file (RFC format) and the SANsymphony Syslog Settings. You can change this port as needed, for example to avoid conflicts with other services or to comply with your network policies, but make sure the same port is configured on both ends and is allowed through the firewall to ensure syslog message flow.
- Run Logstash with the configuration file by executing:
- Wait for Logstash to start and confirm it is running without errors by monitoring the console output. You should see Logstash startup logs indicating it’s listening on UDP port 514.
- Verify the messages are received and processed by checking your target platform (Elastic Search or Splunk), or by observing Logstash console output if using stdout for debugging.
Verifying Syslog Message Forwarding (Optional)
Follow the below steps to validate the syslog message forwarding:
- In DataCore SANsymphony, navigate to Settings > Syslog Settings and confirm the correct syslog server IP and port are configured (example: 10.131.0.58:514).
- Click Test Syslog and ensure the status message reads “Successfully contacted the endpoint from all servers.”
- Use the Add-DcsLogMessage PowerShell cmdlet to manually trigger a Syslog message and verify delivery to the configured endpoint.
-
On the Logstash server, ensure the listener is running and check the terminal for:
- The test message appears in the console output.
- The message is parsed and displayed in JSON format.
Viewing Syslog Messages in Elastic Search and Splunk
After configuring SANsymphony to forward syslog messages, you can view and analyze these logs in third-party platforms such as Elastic Search and Splunk. These tools provide advanced filtering, visualization, and alerting capabilities to help monitor system activity, troubleshoot issues, and maintain operational visibility. The following sections describe how to access and view the forwarded logs in each platform.
Viewing Logs in Elastic Search
Once syslog messages are indexed in Elastic Search, they can be visualized and explored using Kibana.
Ensure an index pattern matching the destination index (example: syslog_5424) is created in Elastic Search. Without this index pattern, no data will be visible in the Discover tab or Dashboards.
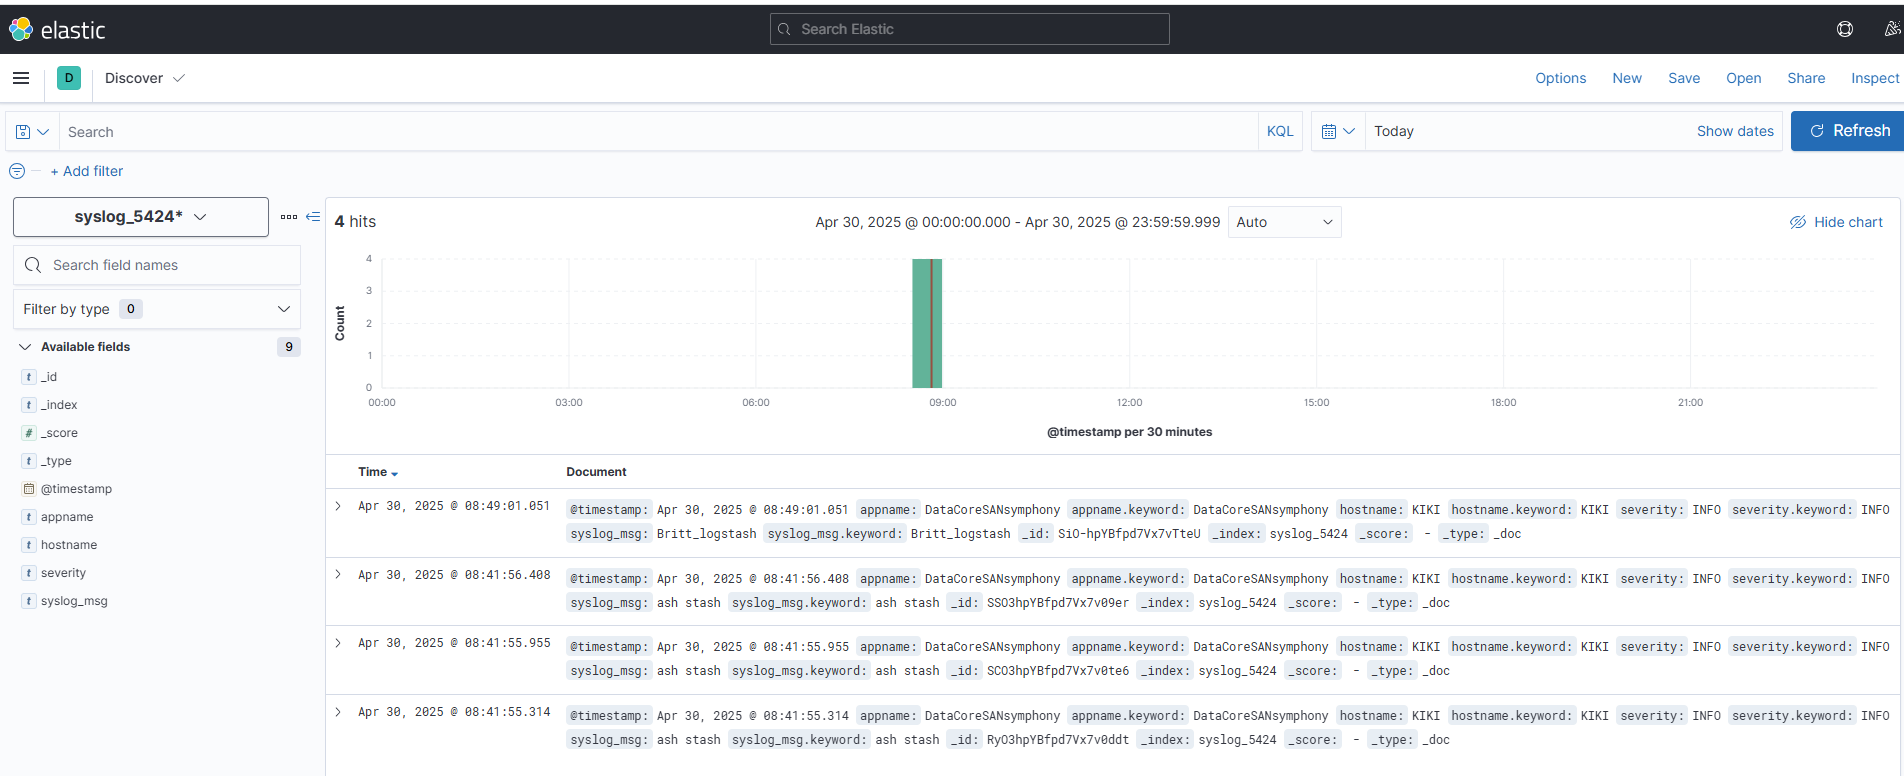
- Open the Discover tab in Kibana.
- Select the index pattern (for example: syslog_5424*) to view the received messages.
- Use the time filter to set the desired date and time range.
-
Log entries appear with fields such as:
- @timestamp: Time of the log.
- appname: Name of the application (example: DataCore SANsymphony).
- hostname: Source system name.
- severity: Log level (example: INFO, ERROR).
- syslog_msg: Message content.
Viewing Logs in Splunk
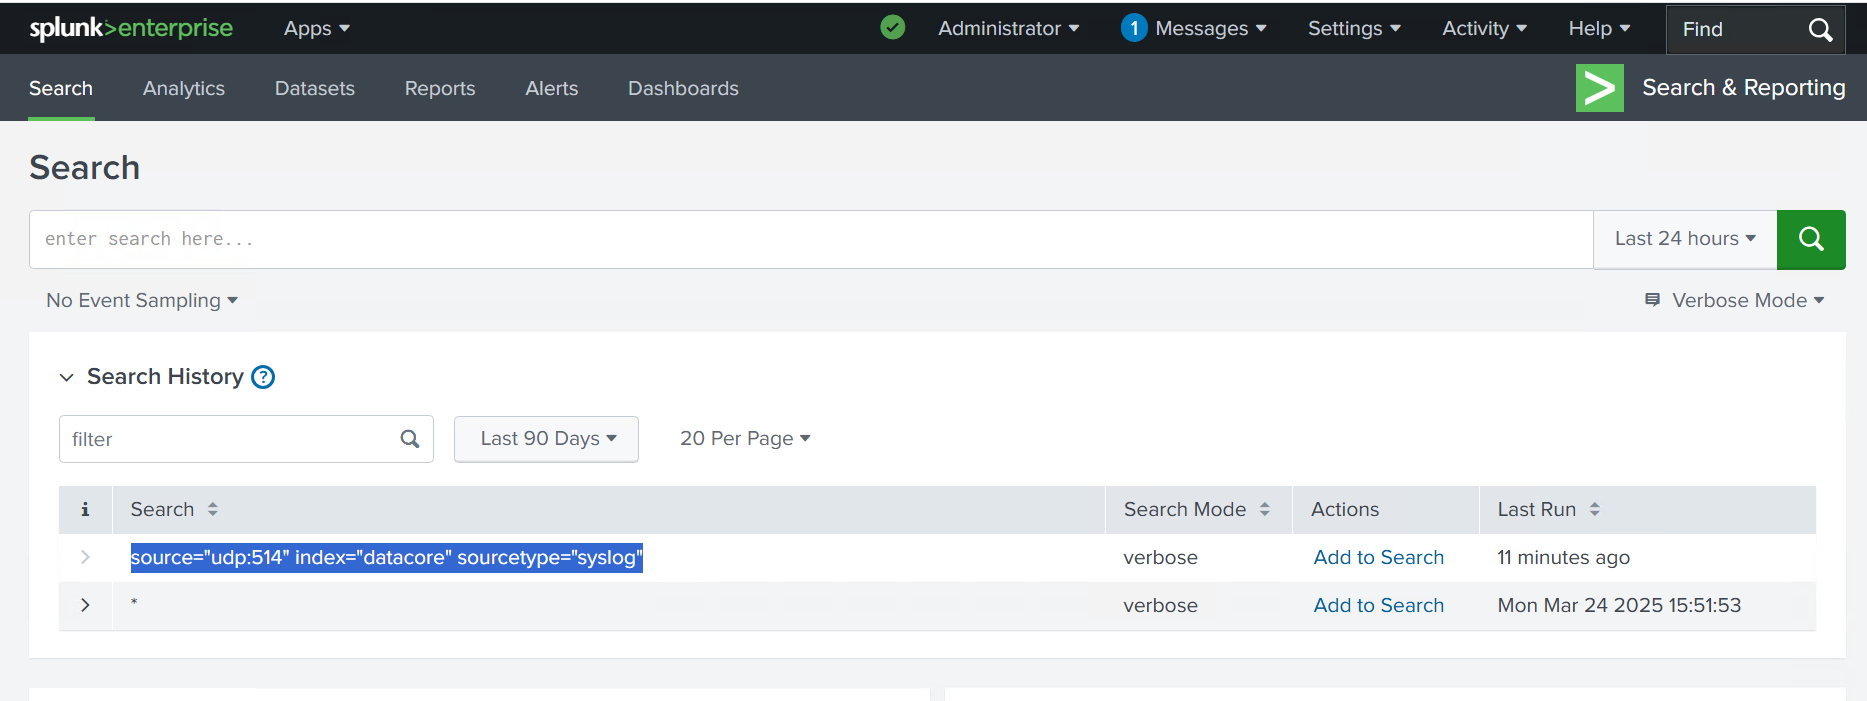
When syslog messages from SANsymphony are forwarded to Splunk, they can be viewed using the Search & Reporting app in Splunk Web.
- Ensure Splunk is configured to listen on the correct UDP port (example: udp: 514).
- Navigate to Settings > Add Data in Splunk Web.
- During the data input setup:
- Under Input Settings, create or select the appropriate Index (for example, datacore, as used in the sample query in Step 4).
- locate the Source Type field, use the filter to search for and select syslog (described as: "Output produced by many syslog daemons, as described in RFC3164 by the IETF").
- Optionally, you may choose Operating System as the category.
- After configuring the data input, go to Search & Reporting and run the following query to view the logs.
You can further refine your search using keywords, field names, or create custom dashboards to visualize patterns or alerts.
Learn More