Monitoring
Explore this Page
- Overview
- Enable Monitoring
- Pool Metrics Exporter
- Node Metrics
- Stats Exporter Metrics
- CSI Metrics Exporter
- Performance Monitoring Stack
- Accessing Grafana
- I/O Performance Metrics
- Benefits of Monitoring
Overview
Effective monitoring is critical for maintaining the health, performance, and reliability of storage infrastructure. DataCore Puls8 exposed Replicated PV Mayastor metrics from two sources:
- The metrics exporter sidecar running in each I/O Engine pod, and
- The
obs-callhome-statscontainer running in the call-home pod.
Volume-level statistics are additionally available through the standard Kubernetes CSI metrics exporter.
This document describes how to enable and disable the monitoring stack, lists the metrics exposed by each exporter along with sample Prometheus output, explains how to derive IOPS, latency, and throughput from the raw counters, and provides steps for accessing the built-in Grafana dashboards.
Enable Monitoring
The DataCore Puls8 monitoring stack is enabled by default when you install DataCore Puls8 using Helm.
If you want to disable monitoring , use the following Helm flag:
This disables the installation of Prometheus, Grafana, and related monitoring components that are part of the DataCore Puls8 monitoring stack.
To collect metrics such as pool usage, volume statistics, and I/O performance, ensure that monitoring is not disabled.
Pool Metrics Exporter
The Pool Metrics Exporter runs as a sidecar container alongside each I/O Engine pod. It exposes Prometheus-compatible pool metrics via the metrics HTTP endpoint on port 9502. These metrics are refreshed every five minutes to reflect recent usage and state information.
Supported Pool Metrics
| Name | Type | Unit | Description |
|---|---|---|---|
|
diskpool_total_size_bytes |
Gauge | Integer | Total size of the pool in bytes |
|
diskpool_used_size_bytes |
Used size of the pool in bytes | ||
|
diskpool_status |
Pool status: 0 = Unknown, 1 = Online, 2 = Degraded, 3 = Faulted, 4 = Suspected | ||
|
diskpool_committed_size_bytes |
Committed size of the pool in bytes | ||
|
diskpool_disk_capacity_bytes |
Capacity of the pool's underlying device, in bytes | ||
|
diskpool_max_expandable_size |
Maximum capacity to which the pool can be expanded, in bytes | ||
|
diskpool_io_alert_status |
Alert status of the pool | ||
|
diskpool_io_stalled |
Indicates whether I/O on the pool is currently stalled | ||
|
diskpool_io_error_count |
Count of I/O errors recorded for the pool | ||
|
diskpool_io_error_threshold |
Configured threshold for I/O errors on the pool | ||
|
diskpool_io_stall_transition_count |
Count of I/O stall transitions recorded for the pool | ||
|
diskpool_io_stall_transition_threshold |
Configured threshold for I/O stall transitions on the pool | ||
|
diskpool_alert_attention_reason |
Collection of reasons contributing to an attention-level pool alert | ||
|
diskpool_alert_warning_reason |
Collection of reasons contributing to a warning-level pool alert | ||
|
diskpool_alert_critical_reason |
Collection of reasons contributing to a critical-level pool alert | ||
|
diskpool_alert_notice_reason |
Collection of reasons contributing to a notice-level pool alert | ||
|
diskpool_num_read_ops |
Number of read operations on the pool | ||
|
diskpool_bytes_read |
Total bytes read on the pool | ||
|
diskpool_num_write_ops |
Number of write operations on the pool | ||
|
diskpool_bytes_written |
Total bytes written on the pool | ||
|
diskpool_read_latency_us |
Total read latency for all IOs on the pool, in microseconds | ||
|
diskpool_write_latency_us |
Total write latency for all IOs on the pool, in microseconds |
The four diskpool_alert_*_reason metrics are each a single gauge, not one counter per reason. In addition to the standard name and node labels, each carries reason labels - io_error, io_error_exc, io_stall_intermittent, io_stall_intermittent_exc, io_stalled, and unknown whose values indicate which condition(s) are contributing to that alert level.
Sample Pool Metrics Output
# HELP diskpool_status Status of the pool
# TYPE diskpool_status gauge
diskpool_status{node="worker-0",name="mayastor-disk-pool"} 1

# HELP diskpool_total_size_bytes Total size of the pool in bytes
# TYPE diskpool_total_size_bytes gauge
diskpool_total_size_bytes{node="worker-0",name="mayastor-disk-pool"} 5360320512

# HELP diskpool_used_size_bytes Used size of the pool in bytes
# TYPE diskpool_used_size_bytes gauge
diskpool_used_size_bytes{node="worker-0",name="mayastor-disk-pool"} 2147483648

# HELP diskpool_committed_size_bytes Committed size of the pool in bytes
# TYPE diskpool_committed_size_bytes gauge
diskpool_committed_size_bytes{node="worker-0",name="mayastor-disk-pool"} 9663676416

# HELP diskpool_disk_capacity_bytes Capacity of the pool's underlying device
# TYPE diskpool_disk_capacity_bytes gauge
diskpool_disk_capacity_bytes{node="worker-0",name="mayastor-disk-pool"} 10737418240

# HELP diskpool_max_expandable_size Maximum capacity to which this pool can be expanded
# TYPE diskpool_max_expandable_size gauge
diskpool_max_expandable_size{node="worker-0",name="mayastor-disk-pool"} 10724835328

# HELP diskpool_io_alert_status DiskPool alert status
# TYPE diskpool_io_alert_status gauge
diskpool_io_alert_status{node="worker-0",name="mayastor-disk-pool"} 0

# HELP diskpool_io_stalled Stalled I/O operations in the pool
# TYPE diskpool_io_stalled gauge
diskpool_io_stalled{node="worker-0",name="mayastor-disk-pool"} 0

# HELP diskpool_alert_attention_reason Collection of reason for attention alert
# TYPE diskpool_alert_attention_reason gauge
diskpool_alert_attention_reason{node="worker-0",name="mayastor-disk-pool",io_error="0",io_error_exc="0",io_stall_intermittent="0",io_stall_intermittent_exc="0",io_stalled="0",unknown="0"} 0

# HELP diskpool_num_read_ops Number of read operations on the pool
# TYPE diskpool_num_read_ops gauge
diskpool_num_read_ops{node="worker-0",name="mayastor-disk-pool"} 128

# HELP diskpool_bytes_read Total bytes read on the pool
# TYPE diskpool_bytes_read gauge
diskpool_bytes_read{node="worker-0",name="mayastor-disk-pool"} 3198976

# HELP diskpool_num_write_ops Number of write operations on the pool
# TYPE diskpool_num_write_ops gauge
diskpool_num_write_ops{node="worker-0",name="mayastor-disk-pool"} 64

# HELP diskpool_bytes_written Total bytes written on the pool
# TYPE diskpool_bytes_written gauge
diskpool_bytes_written{node="worker-0",name="mayastor-disk-pool"} 1048576

# HELP diskpool_read_latency_us Total read latency for all IOs on the pool
# TYPE diskpool_read_latency_us gauge
diskpool_read_latency_us{node="worker-0",name="mayastor-disk-pool"} 52340

# HELP diskpool_write_latency_us Total write latency for all IOs on the pool
# TYPE diskpool_write_latency_us gauge
diskpool_write_latency_us{node="worker-0",name="mayastor-disk-pool"} 21870
Node Metrics
The metrics exporter also reports the operational state of each Replicated PV Mayastor node, exposed at the same 9502 /metrics endpoint as the pool metrics.
Supported Node Metrics
| Name | Type | Labels | Description |
|---|---|---|---|
|
mayastor_node_online |
Gauge | node_id
|
Indicates whether the node is online |
|
mayastor_node_cordoned |
Indicates whether the node is cordoned | ||
|
mayastor_node_draining |
Indicates whether the node is draining |
Sample Node Metrics Output
# HELP mayastor_node_online Indicates if Mayastor node is online
# TYPE mayastor_node_online gauge
mayastor_node_online{node_id="worker-0"} 1

# HELP mayastor_node_cordoned Indicates if Mayastor node is cordoned
# TYPE mayastor_node_cordoned gauge
mayastor_node_cordoned{node_id="worker-0"} 0

# HELP mayastor_node_draining Indicates if Mayastor node is draining
# TYPE mayastor_node_draining gauge
mayastor_node_draining{node_id="worker-0"} 0
Stats Exporter Metrics
When eventing is enabled, statistics are collected by the obs-callhome-stats container within the callhome pod. These metrics are exposed on port 9090 at the /stats endpoint. They are cumulative event (lifecycle action) counters, distinct from the per-resource I/O metrics reported by the Pool, Node, Replica, and Volume metrics described above - the two exporters run on separate ports and paths, so do not assume both live in the same scrape target.
Supported Statistics Metric
| Metric | Type | Labels | Description |
|---|---|---|---|
|
nexus |
counter | action="created"
|
Total nexus creation events |
action="deleted"
|
Total nexus deletion events | ||
action="rebuild_started"
|
Total nexus rebuild-started events | ||
action="rebuild_ended"
|
Total nexus rebuild-ended events | ||
|
pool |
action="created"
|
Total pool creation events | |
action="deleted"
|
Total pool deletion events | ||
|
volume |
action="created"
|
Total volume creation events | |
action="deleted"
|
Total volume deletion events |
nexus, pool, and volume are each a single counter metric, the different lifecycle events are distinguished by the action label rather than being separate metric names.
# HELP nexus Nexus stats
# TYPE nexus counter
nexus{action="created"} 21
nexus{action="deleted"} 18
nexus{action="rebuild_ended"} 0
nexus{action="rebuild_started"} 0

# HELP pool Pool stats
# TYPE pool counter
pool{action="created"} 3
pool{action="deleted"} 0

# HELP volume Volume stats
# TYPE volume counter
volume{action="created"} 6
volume{action="deleted"} 15
CSI Metrics Exporter
The CSI metrics exporter provides insights into volume-level statistics. These metrics are collected by kubelet and exported for Prometheus monitoring.
Supported Volume Metrics
| Name | Type | Unit | Description |
|---|---|---|---|
|
kubelet_volume_stats_available_bytes |
Gauge | Integer | Usable size of the volume in bytes |
|
kubelet_volume_stats_capacity_bytes |
Total capacity of the volume in bytes | ||
|
kubelet_volume_stats_used_bytes |
Amount of used space in bytes | ||
|
kubelet_volume_stats_inodes |
Total number of inodes | ||
| kubelet_volume_stats_inodes_free | Count of available inodes | ||
| kubelet_volume_stats_inodes_used | Number of inodes used for metadata |
Performance Monitoring Stack
Initially, metrics exporters cached data which might not reflect real-time usage during Prometheus polls. This has been improved by directly querying the IO Engine in sync with the Prometheus polling cycle.
It is recommended to set the Prometheus poll interval to at least 5 minutes.
Accessing Grafana
Grafana provides a visual interface to monitor metrics collected by Prometheus. To access Grafana in your environment, follow these steps:
-
Verify the Grafana Pod is running.
-
Check the Grafana service IP and port.
-
Access Grafana via Port-Forwarding.
- Use port-forwarding to connect to Grafana locally if external access is not available:
- Once port-forwarding is established, Open a browser and visit
http://127.0.0.1:[grafana-forward-port](Example:http://127.0.0.1:8080). - Use the default login credentials:
Username: adminandPassword: admin. - To view the Puls8 dashboards, click Dashboards on the left-hand panel. The Dashboards page lists all available dashboards, including the following Puls8 dashboards:
- Cluster Summary Dashboard
- DiskPool
- Volume
- Volume Replica
- ZFS-LocalPV
- LVM Pool
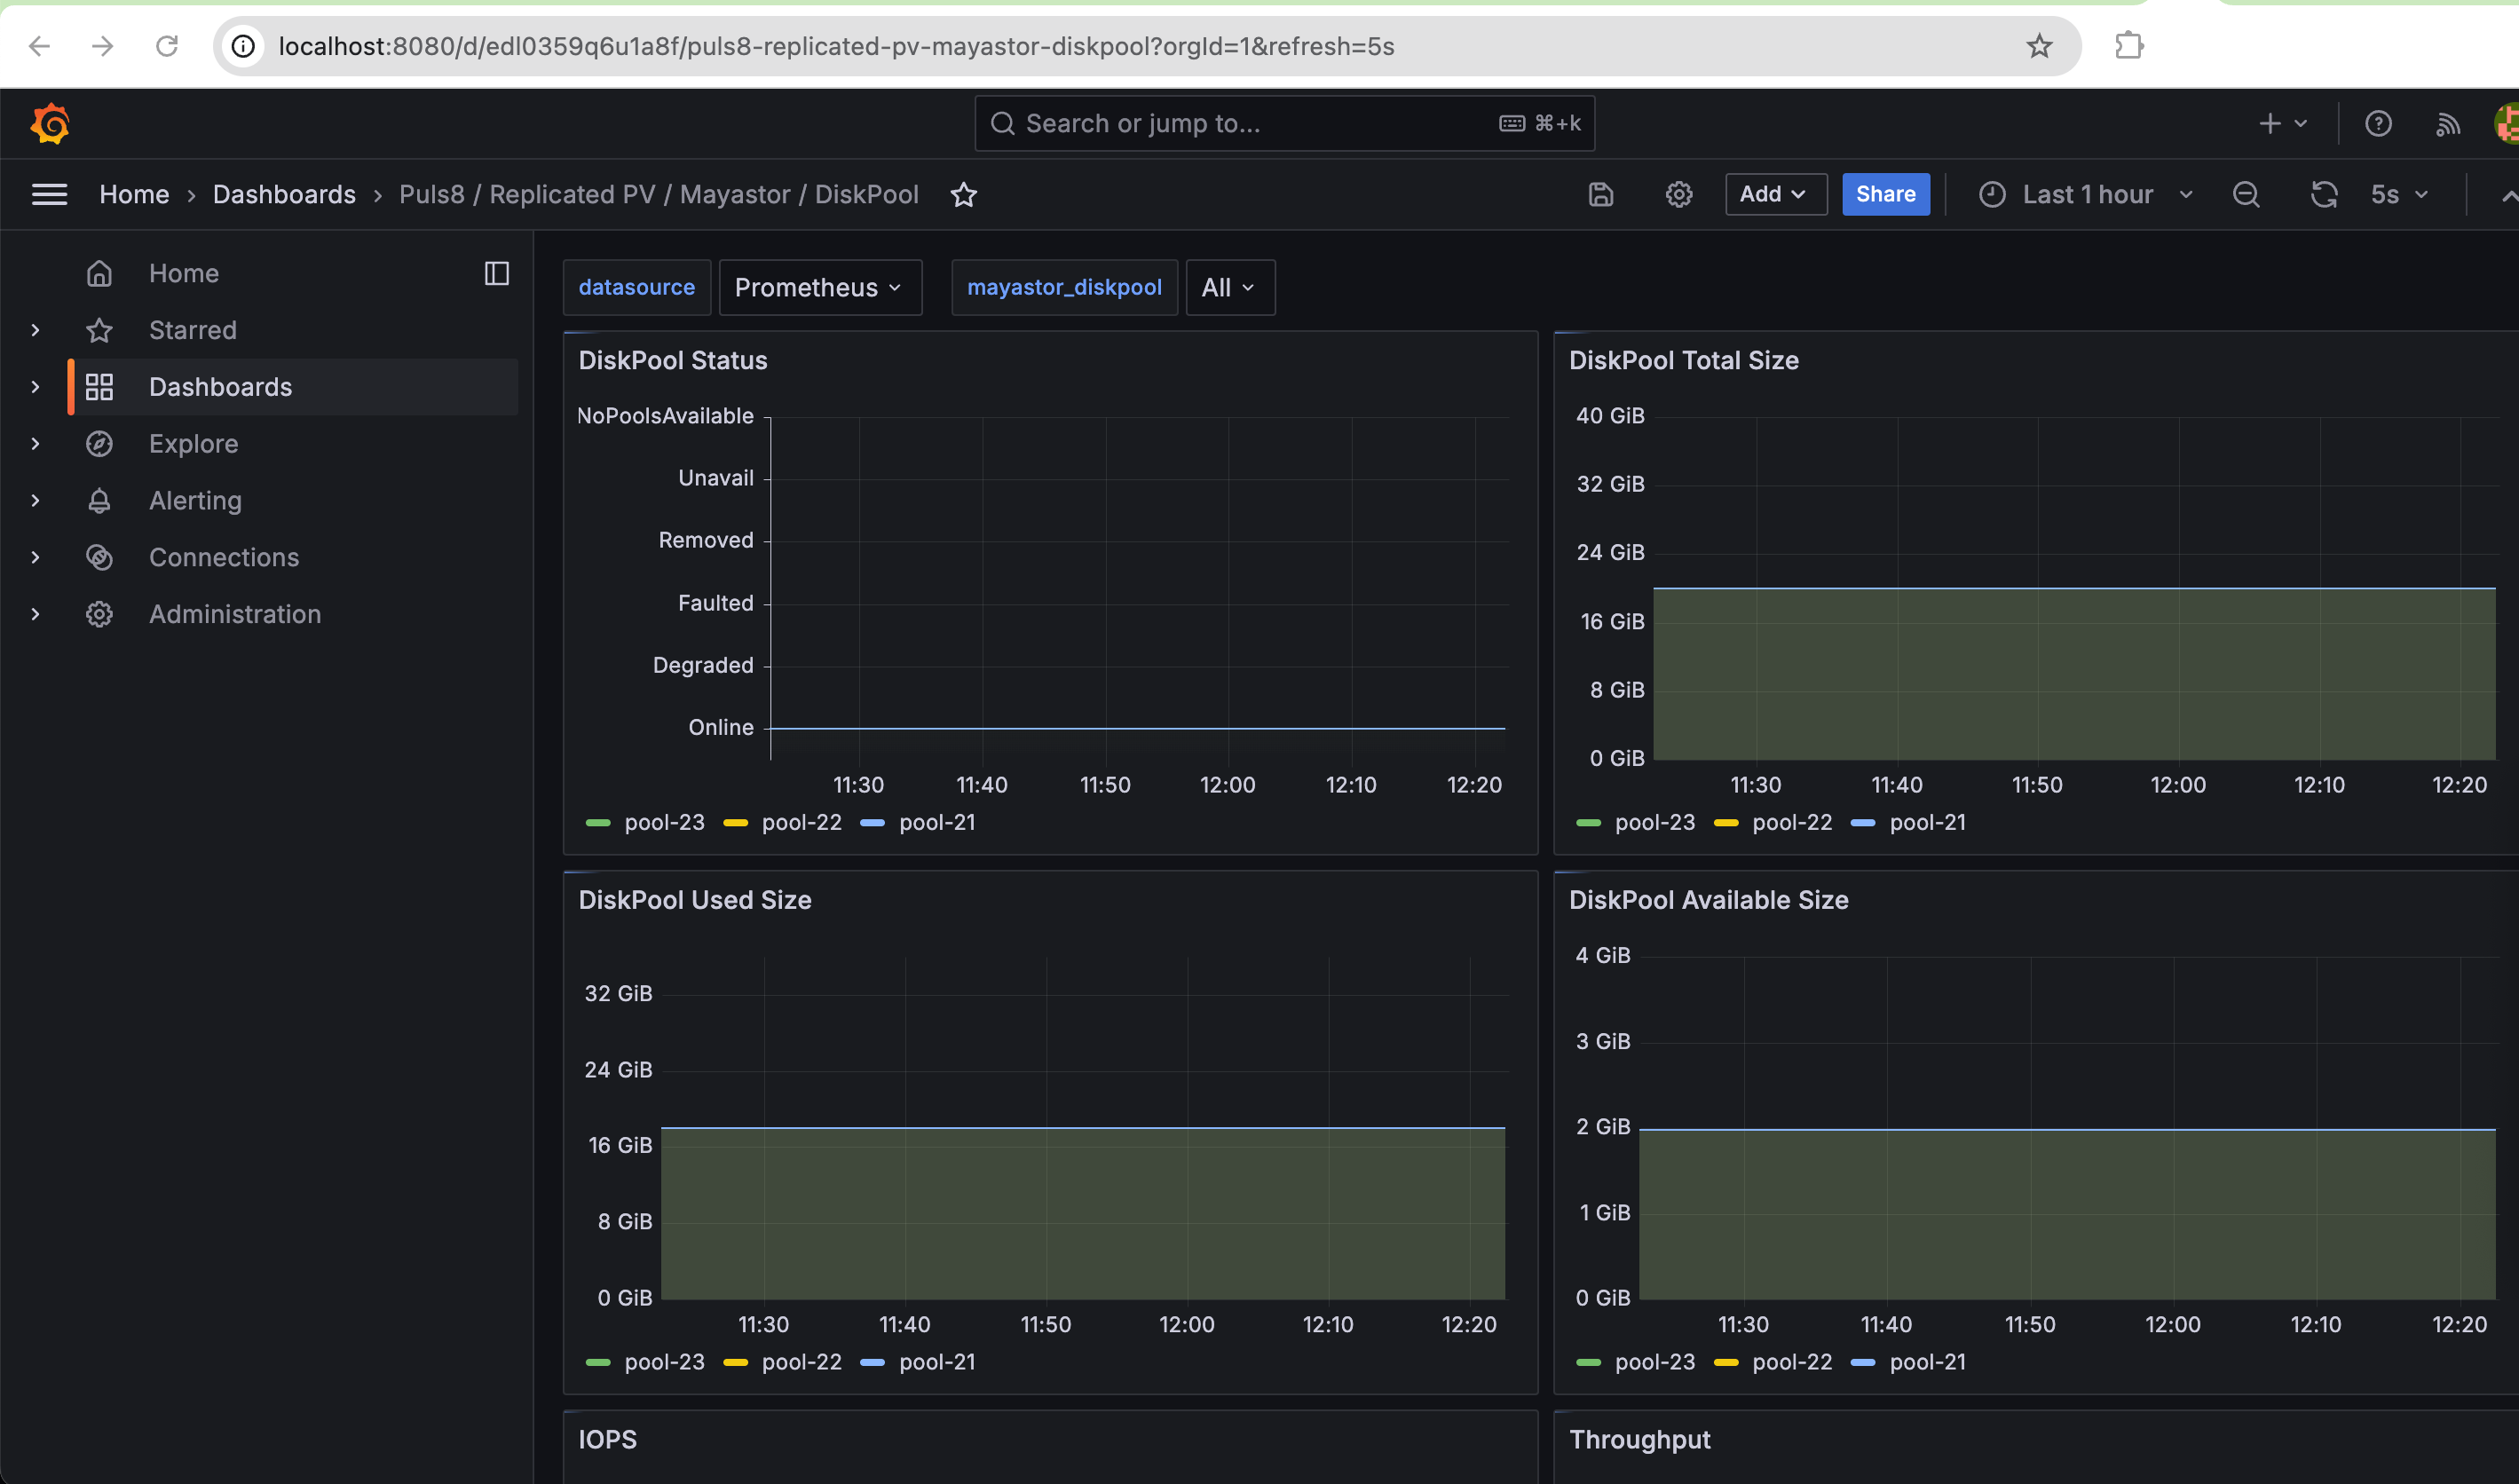
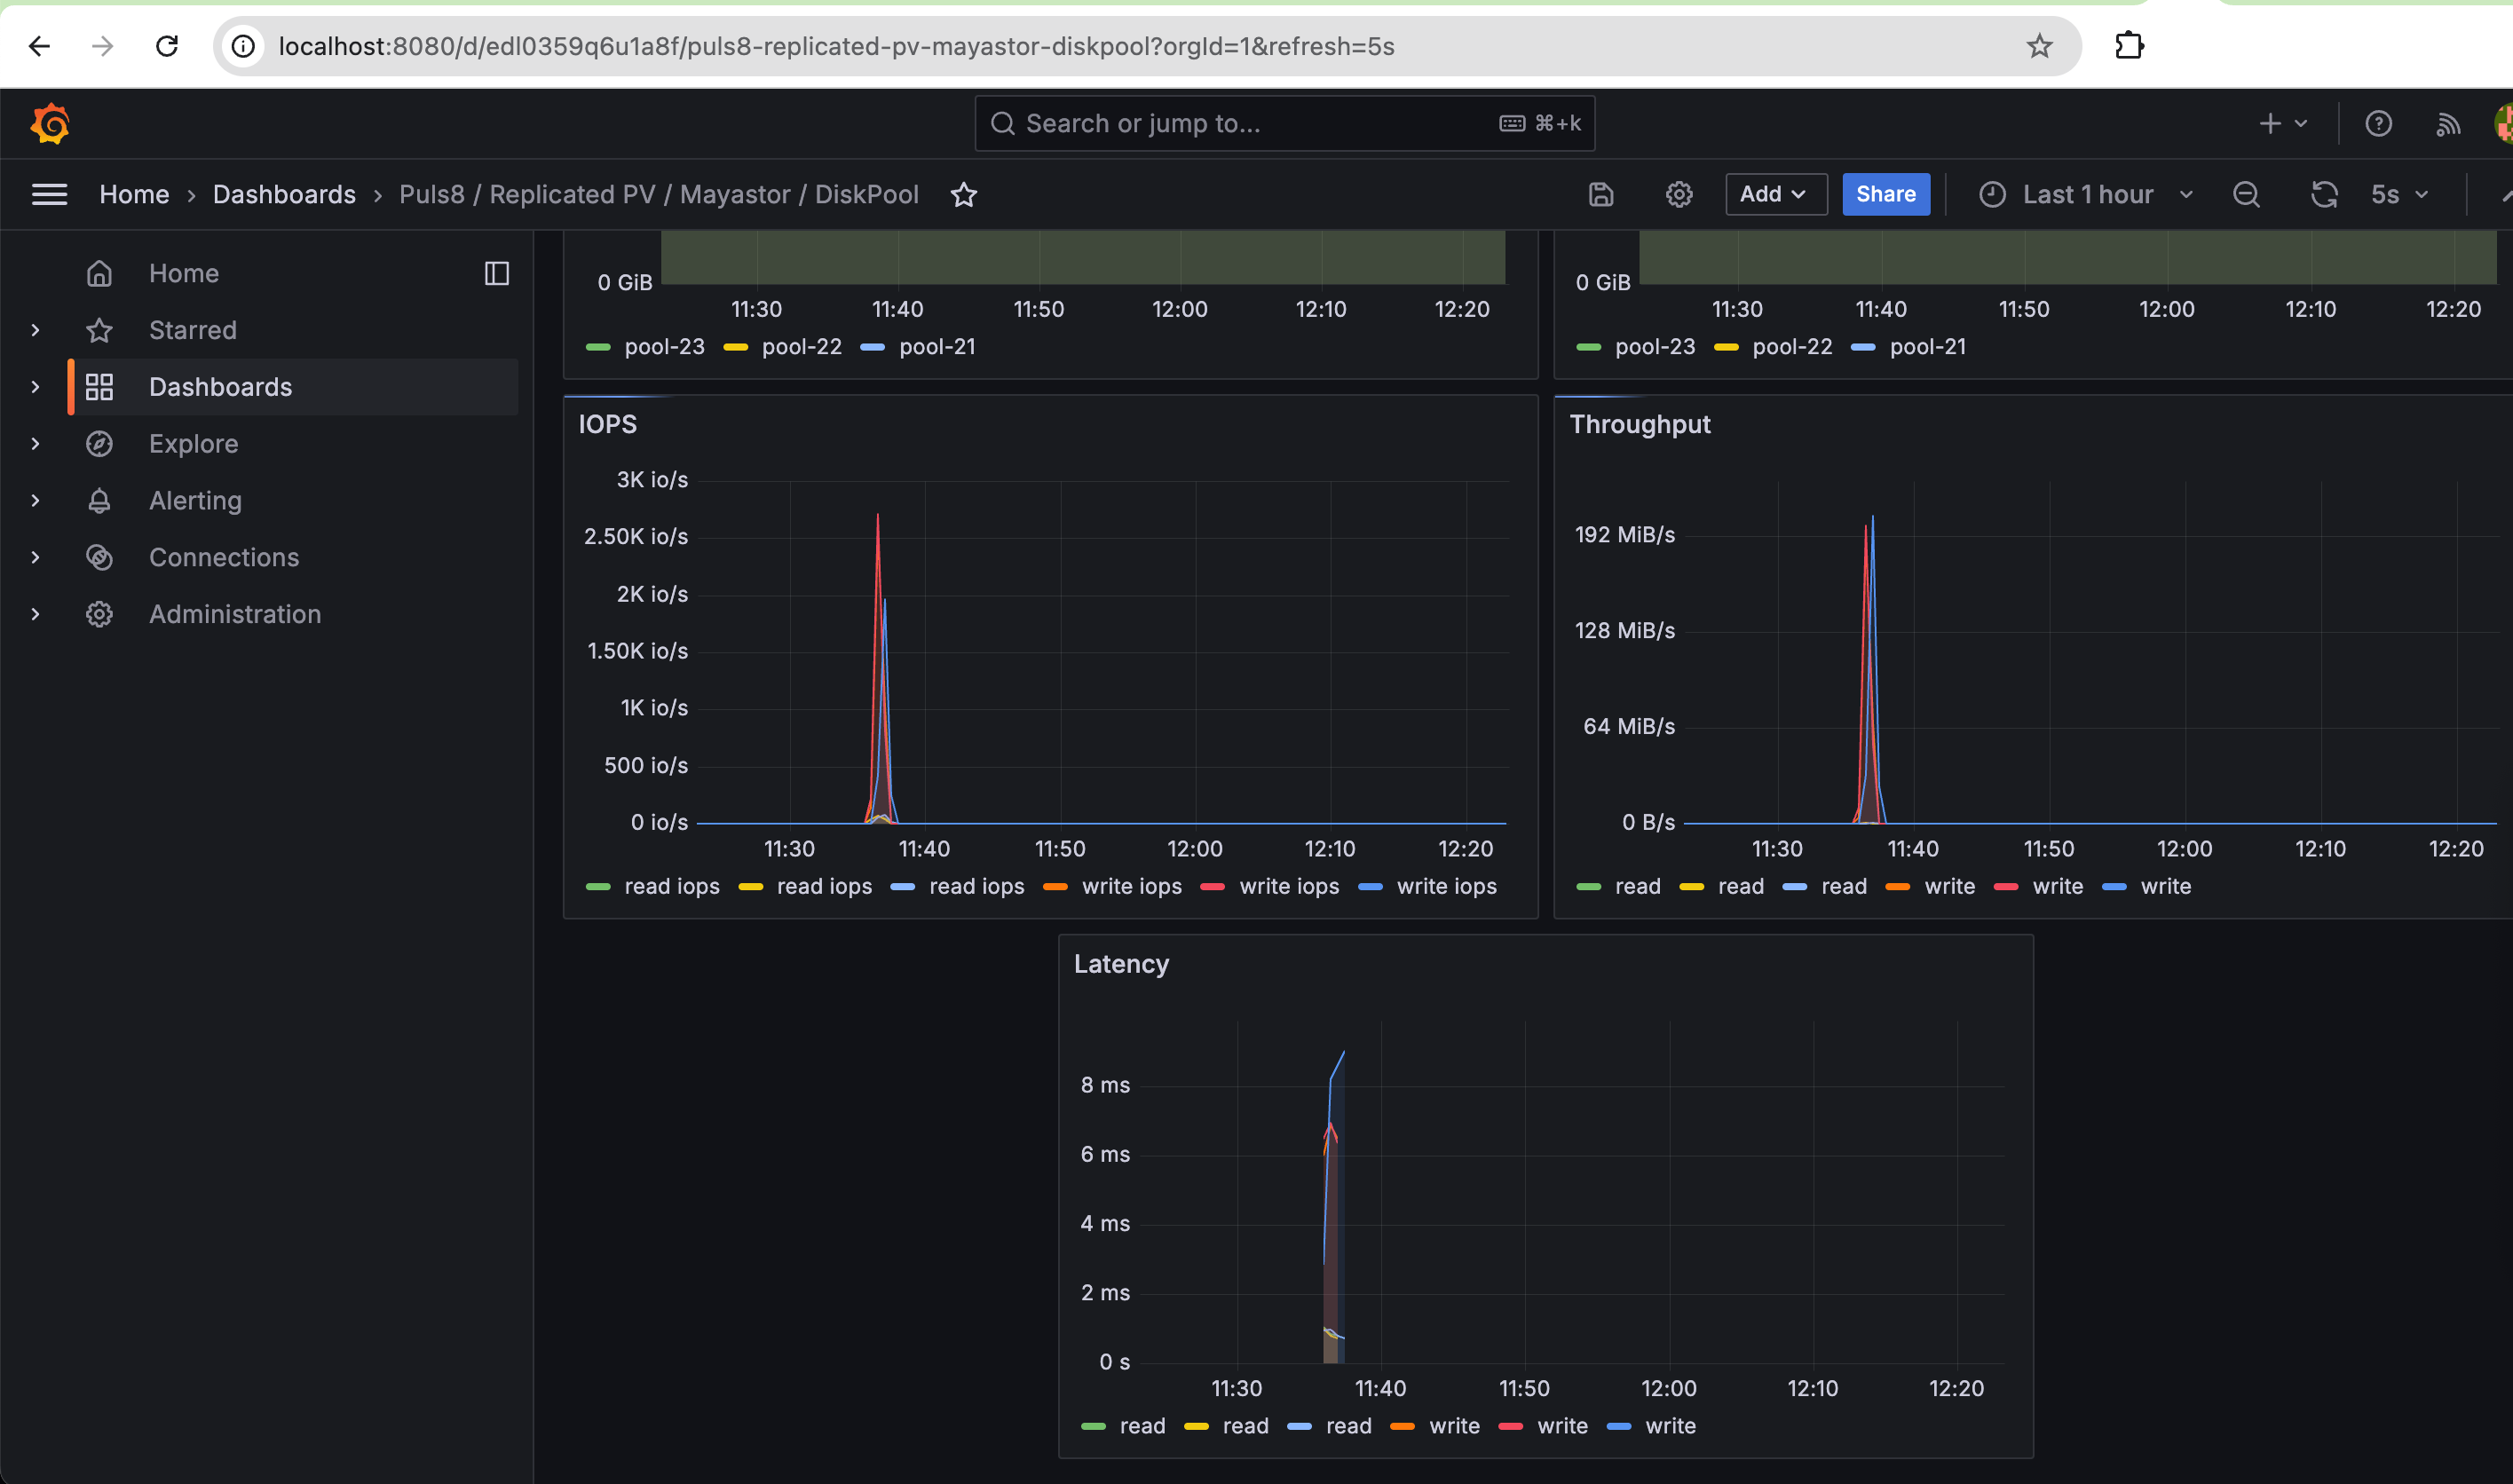
- For example, selecting
Puls8/Replicated PV/Mayastor/DiskPooldisplays the following panels:- DiskPool Total Size
- DiskPool Available Size
- DiskPool Used Size
- DiskPool Status
- IOPS
- Throughput
- Latency
- IO Size
CopyConnect to Grafana Locallykubectl port-forward --namespace [NAMESPACE] pods/[grafana-pod-name] [grafana-forward-port]:[grafana-cluster-port]CopyExample: Port Forward the Grafana Service from the Puls8 Namespace to Your Local Port 8080kubectl port-forward svc/puls8-grafana -n puls8 8080:80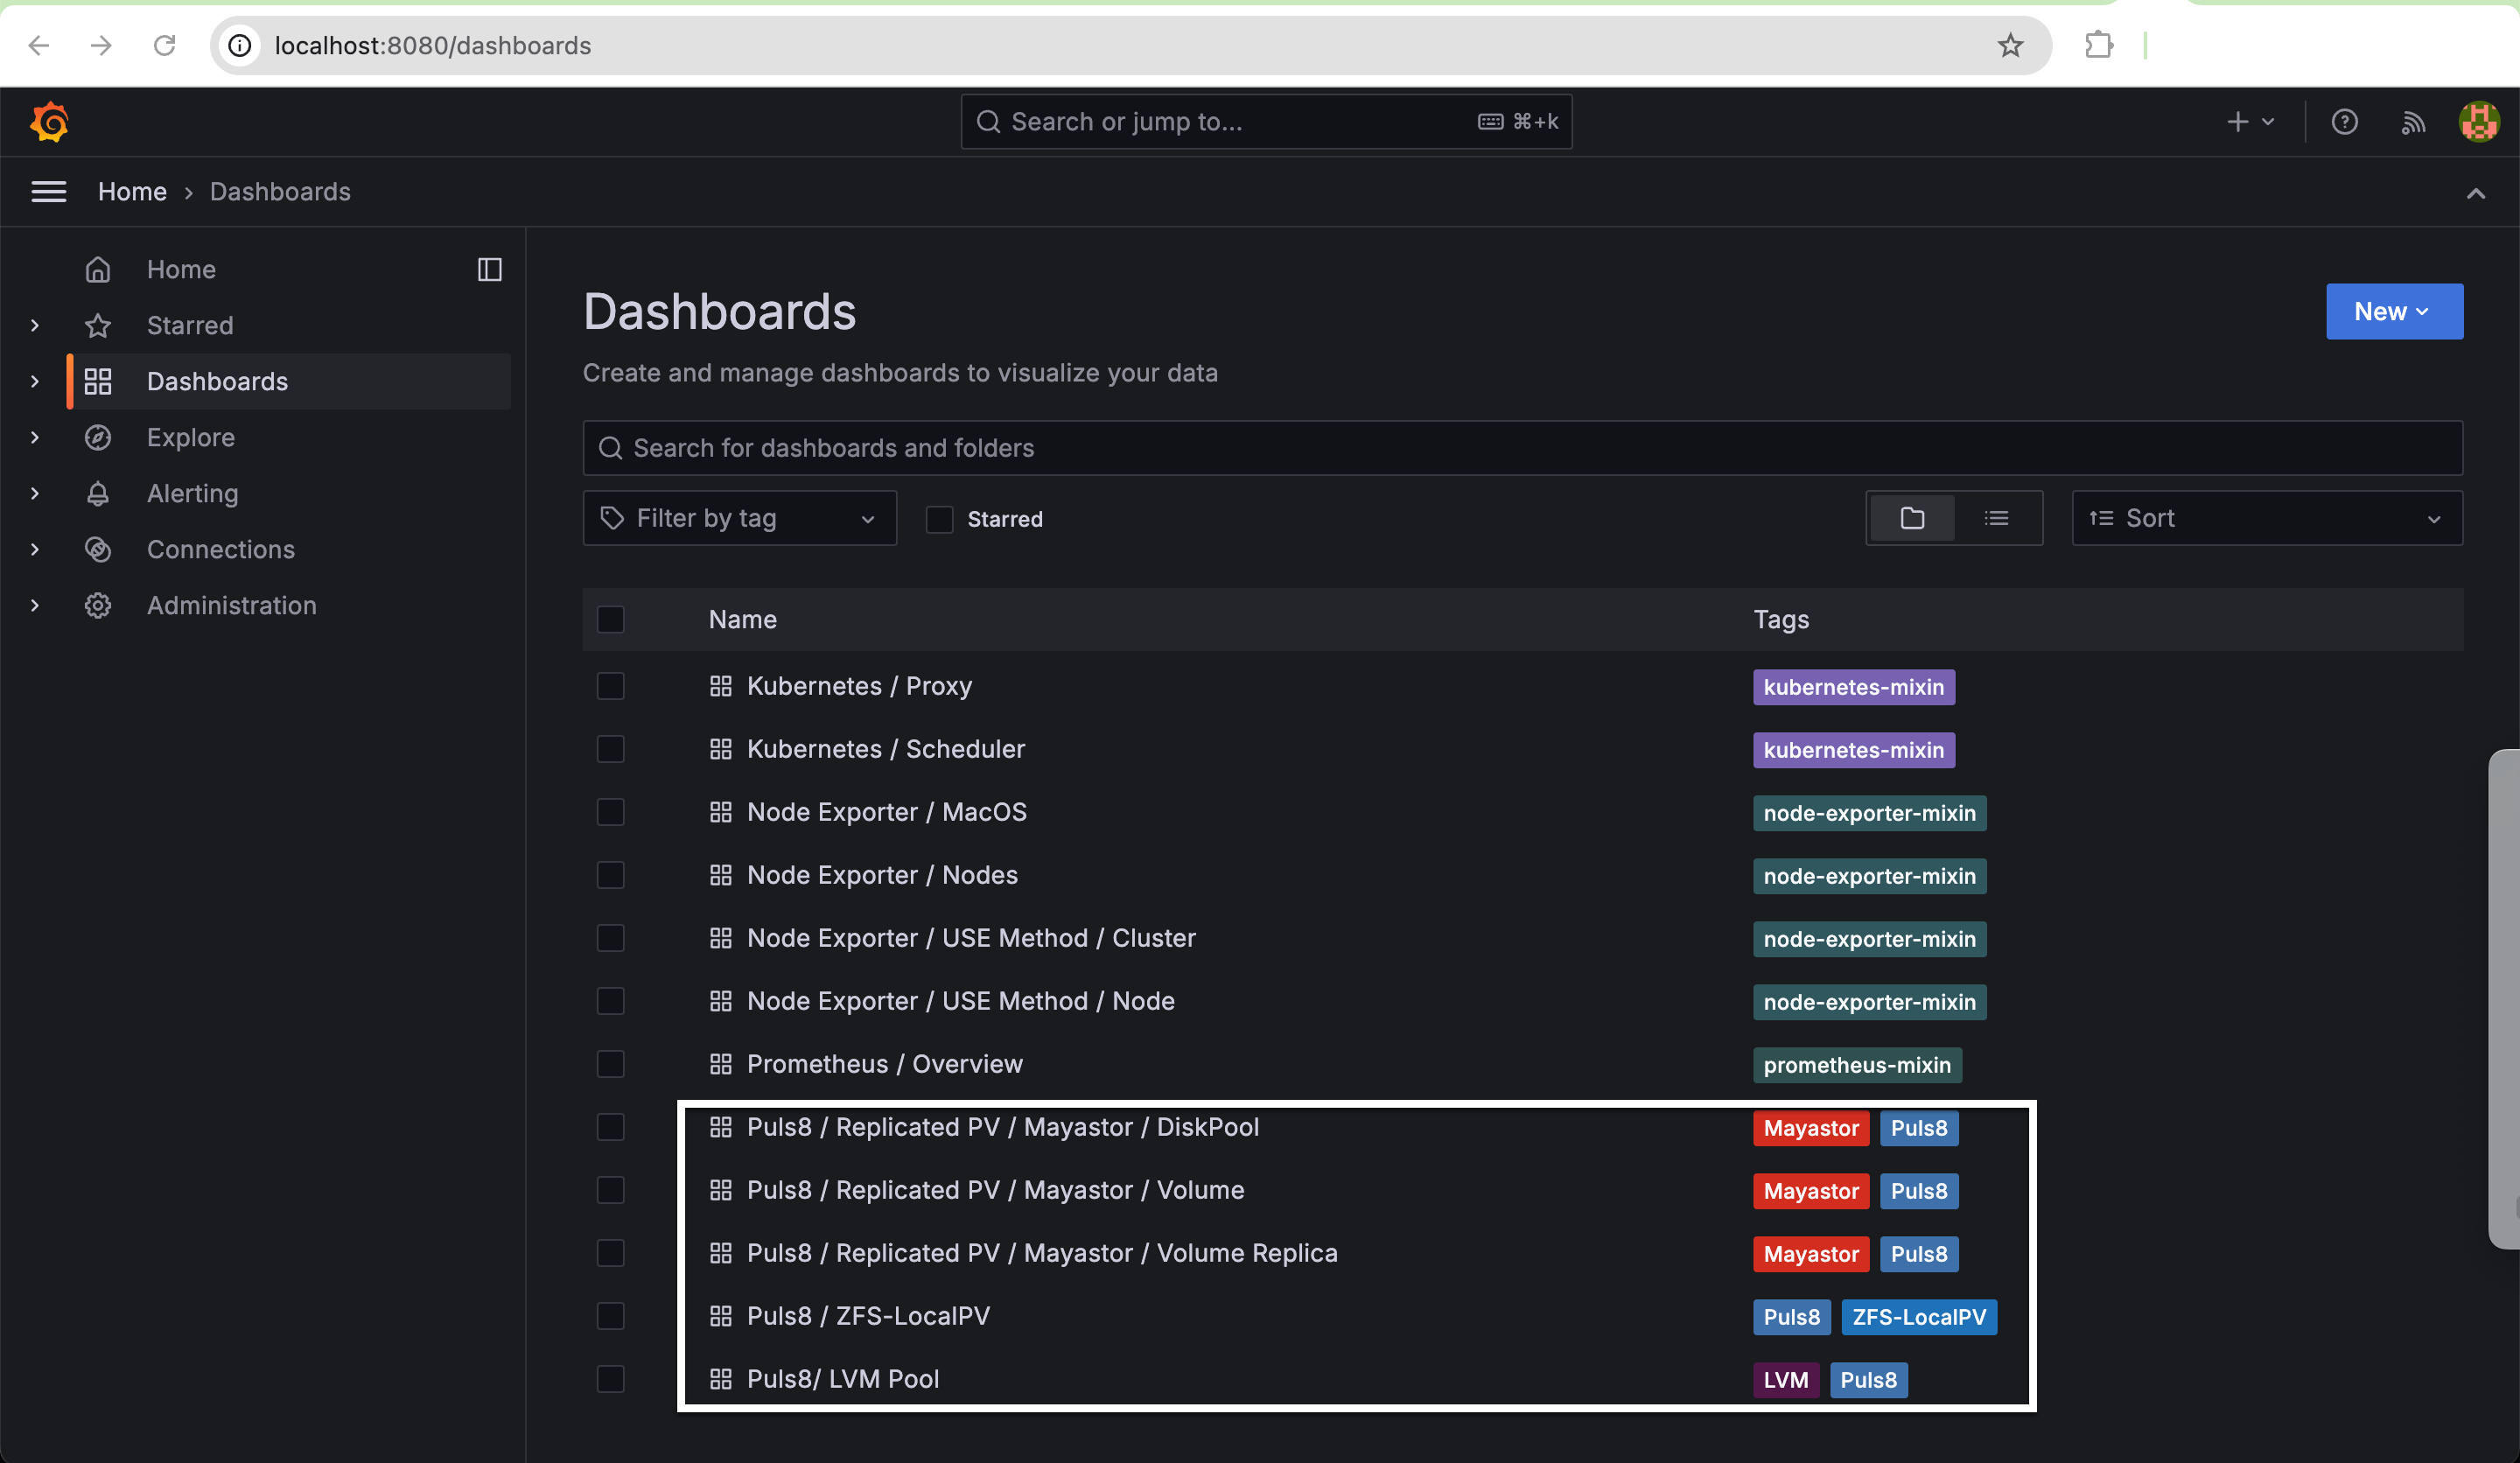
I/O Performance Metrics
DiskPool I/O performance counters (diskpool_num_read_ops, diskpool_bytes_read, diskpool_num_write_ops, diskpool_bytes_written, diskpool_read_latency_us, diskpool_write_latency_us) are documented under Pool Metrics Exporter above, alongside the pool's capacity, status, and alert metrics. This section covers the remaining Replica and Volume Target I/O statistics.
Replica I/O Statistics
| Name | Type | Labels | Unit | Description |
|---|---|---|---|---|
| replica_num_read_ops | Gauge |
|
Integer | Number of read operations on replica |
|
replica_bytes_read |
Total bytes read on the replica | |||
|
replica_num_write_ops |
Number of write operations | |||
| replica_bytes_written | Total bytes written | |||
| replica_read_latency_us | Read latency in microseconds | |||
| replica_write_latency_us | Write latency in microseconds |
Sample Replica I/O Statistics Output
# HELP replica_bytes_read Total bytes read on the replica
# TYPE replica_bytes_read gauge
replica_bytes_read{name="77c600a8-6709-4779-9a8f-7e86b8cf005e",node="worker-0",pool_name="mayastor-disk-pool",pool_uuid="5c9c5b1a-1f2e-4a3b-9c0d-8e7f6a5b4c3d",pv_name="pvc-86e8ccf8-3fcd-4d5a-847c-60016f722403"} 3145728

# HELP replica_num_read_ops Number of read operations on the replica
# TYPE replica_num_read_ops gauge
replica_num_read_ops{name="77c600a8-6709-4779-9a8f-7e86b8cf005e",node="worker-0",pool_name="mayastor-disk-pool",pool_uuid="5c9c5b1a-1f2e-4a3b-9c0d-8e7f6a5b4c3d",pv_name="pvc-86e8ccf8-3fcd-4d5a-847c-60016f722403"} 24
Volume Target I/O Statistics
| Name | Type | Labels | Unit | Description |
|---|---|---|---|---|
| volume_num_read_ops | Gauge |
|
Integer | Number of read operations via volume |
|
volume_bytes_read |
Total bytes read via volume | |||
|
volume_num_write_ops |
Number of write operations via volume | |||
| volume_bytes_written | Total bytes written via volume | |||
| volume_read_latency_us | Read latency in microseconds | |||
| volume_write_latency_us | Write latency in microseconds |
Sample Volume Target I/O Statistics Output
# HELP volume_bytes_read Total bytes read through the volume target
# TYPE volume_bytes_read gauge
volume_bytes_read{node="worker-0",pv_name="pvc-86e8ccf8-3fcd-4d5a-847c-60016f722403"} 9437184

# HELP volume_num_read_ops Number of read operations through the volume target
# TYPE volume_num_read_ops gauge
volume_num_read_ops{node="worker-0",pv_name="pvc-86e8ccf8-3fcd-4d5a-847c-60016f722403"} 72

# HELP volume_read_latency_us Total read latency for all IOs through the volume target
# TYPE volume_read_latency_us gauge
volume_read_latency_us{node="worker-0",pv_name="pvc-86e8ccf8-3fcd-4d5a-847c-60016f722403"} 149780
Dashboard Calculation
The metrics above are raw, cumulative per-resource totals. To derive IOPS, latency, or throughput for a dashboard, compute the formulas below across two successive polls of the same resource - pool, replica, or volume:
IOPS Calculation
read_iops = num_read_ops (current poll) - num_read_ops (previous_poll) / poll period (in sec)write_iops = num_write_ops (current poll) - num_write_ops (previous_poll) / poll period (in sec)Latency Calculation
read_latency_avg = read_latency (current poll) - read_latency (previous poll) / num_read_ops (current poll) - num_read_ops (previous_poll)write_latency_avg = write_latency (current poll) - write_latency (previous poll) / num_write_ops (current poll) - num_write_ops (previous_poll)If num_read_ops or num_write_ops is unchanged between the current and previous poll (no I/O occurred on that resource in the interval), the corresponding average latency cannot be computed. Treat this case as 0 or NaN in dashboards rather than dividing by zero.
Throughput Calculation
read_throughput = bytes_read (current poll) - bytes_read (previous_poll) / poll period (in sec)write_throughput = bytes_written (current poll) - bytes_written (previous_poll) / poll period (in sec)Handling Counter Resets
Performance counters are not persistent across IO Engine restarts. If a reset occurs, current counter values may be less than previous values, leading to negative results. To address this, use fallback calculations based on current values only:
iops (r/w) = num_ops (r/w) / poll cycle
latency_avg(r/w) = latency (r/w) / num_ops
throughput (r/w) = bytes_read/written / poll_cycle (in secs)
Sample Scrape
A single live scrape of the metrics exporter endpoint (port 9502, /metrics) returns all resource types together, for example:
# HELP diskpool_alert_attention_reason Collection of reason for attention alert
# TYPE diskpool_alert_attention_reason gauge
diskpool_alert_attention_reason{io_error="0",io_error_exc="0",io_stall_intermittent="0",io_stall_intermittent_exc="0",io_stalled="0",name="mayastor-disk-pool",node="worker-0",unknown="0"} 0
# HELP diskpool_bytes_read Total bytes read on the pool
# TYPE diskpool_bytes_read gauge
diskpool_bytes_read{name="mayastor-disk-pool",node="worker-0"} 3198976
# HELP diskpool_bytes_written Total bytes written on the pool
# TYPE diskpool_bytes_written gauge
diskpool_bytes_written{name="mayastor-disk-pool",node="worker-0"} 0
# HELP diskpool_committed_size_bytes Committed size of the pool in bytes
# TYPE diskpool_committed_size_bytes gauge
diskpool_committed_size_bytes{name="mayastor-disk-pool",node="worker-0"} 1073741824
# HELP diskpool_disk_capacity_bytes Capacity of the Pool's underlying device
# TYPE diskpool_disk_capacity_bytes gauge
diskpool_disk_capacity_bytes{name="mayastor-disk-pool",node="worker-0"} 10737418240
# HELP diskpool_status Status of the pool
# TYPE diskpool_status gauge
diskpool_status{name="mayastor-disk-pool",node="worker-0"} 1
# HELP diskpool_total_size_bytes Total size of the pool in bytes
# TYPE diskpool_total_size_bytes gauge
diskpool_total_size_bytes{name="mayastor-disk-pool",node="worker-0"} 10724835328
# HELP diskpool_used_size_bytes Used size of the pool in bytes
# TYPE diskpool_used_size_bytes gauge
diskpool_used_size_bytes{name="mayastor-disk-pool",node="worker-0"} 1073741824
# HELP mayastor_node_online Indicates if Mayastor node is online
# TYPE mayastor_node_online gauge
mayastor_node_online{node_id="worker-0"} 1
# HELP replica_bytes_read Total bytes read on the replica
# TYPE replica_bytes_read gauge
replica_bytes_read{name="77c600a8-6709-4779-9a8f-7e86b8cf005e",node="worker-0",pool_name="mayastor-disk-pool",pool_uuid="5c9c5b1a-1f2e-4a3b-9c0d-8e7f6a5b4c3d",pv_name="pvc-86e8ccf8-3fcd-4d5a-847c-60016f722403"} 3145728
# HELP replica_num_read_ops Number of read operations on the replica
# TYPE replica_num_read_ops gauge
replica_num_read_ops{name="77c600a8-6709-4779-9a8f-7e86b8cf005e",node="worker-0",pool_name="mayastor-disk-pool",pool_uuid="5c9c5b1a-1f2e-4a3b-9c0d-8e7f6a5b4c3d",pv_name="pvc-86e8ccf8-3fcd-4d5a-847c-60016f722403"} 24
# HELP volume_bytes_read Total bytes read from the volume
# TYPE volume_bytes_read gauge
volume_bytes_read{node="worker-0",pv_name="pvc-86e8ccf8-3fcd-4d5a-847c-60016f722403"} 9437184
# HELP volume_num_read_ops Number of read operations on the volume
# TYPE volume_num_read_ops gauge
volume_num_read_ops{node="worker-0",pv_name="pvc-86e8ccf8-3fcd-4d5a-847c-60016f722403"} 72
# HELP volume_read_latency_us Total read latency on the volume in usec
# TYPE volume_read_latency_us gauge
volume_read_latency_us{node="worker-0",pv_name="pvc-86e8ccf8-3fcd-4d5a-847c-60016f722403"} 149780
Truncated for brevity - every metric in the Pool, Node, Replica, and Volume tables above follows this same # HELP / # TYPE / sample-line pattern on a live scrape.
Benefits of Monitoring
- Enables real-time visibility into storage usage, performance, and system health.
- Assists in proactive detection and resolution of issues before they impact workloads.
- Provides historical data for capacity planning and trend analysis.
- Facilitates compliance with SLAs and performance benchmarks.
Learn More