System Health Thresholds
Explore this Page
- About System Health Thresholds
- Disk Pools
- Physical Disks
- Ports
- Replication Buffers
- Virtual Disks
- Global Default Thresholds
About System Health Thresholds
Internal system monitors are used to report events to the System Health tool when status changes for a managed resource. Thresholds can be set for use with certain monitors associated with important events in disk pools, physical disks (including DataCore disks), virtual disks, replication buffers, and Fibre Channel ports. These thresholds have default values, but the settings can be customized. Monitors will report when a threshold has been reached, which will trigger the posting of the appropriate level message to System Health and Event Log. An alert is posted for critical level thresholds.
Disk Pools
Disk pools have two different monitors with custom threshold settings.
Available Space Thresholds
The available space threshold alerts the administrator when available space reaches the percentage set in the threshold tool and more disks need to be added to pools. The percentage of available space includes the amount of space in reclamation. When the available space reaches the percentage set for a threshold, the appropriate level message is generated.
When notification is received that a threshold has been reached, add more physical disks to the pool as required. When more physical storage is added to the pool, the capacity growth occurs transparently to the host. If the free space in the pool is depleted, new virtual disks can no longer be created from the pool and write I/Os to existing virtual disks from the pool will fail until more storage is available.
Three thresholds can be set:
- Attention level (default setting is 30%)
- Warning level (default setting is 20%)
- Critical level (default setting is 10%)
To change the threshold alerts:
- In the DataCore Servers panel, click on the pool to open the Disk Pool Details page.
- In the Settings tab, under System Health Thresholds area, enter the new percentage values for the thresholds in the Available space thresholds boxes.
- Click Apply.
I/O Latency Thresholds
I/O latency generally occurs due to high load on slow disks and may not affect all storage sources from the same pool. The I/O latency thresholds monitor all read and write I/O to storage sources in disk pools and provides alerts when I/O latency for a storage source reaches the set threshold. Events are reported per storage source. When the latency time exceeds the threshold, the appropriate level message is generated. Use the diagnostic tools such as Live Performance, and the Allocation View to troubleshoot the latency issues to determine what resource is causing the I/O transfer to slow down.
Three thresholds can be set:
- Attention level (default setting is 120 ms- milliseconds)
- Warning level (default setting is 240 ms)
- Critical level (default setting is 480 ms)
To change the threshold alerts:
- In the DataCore Servers panel, click on the pool to open the Disk Pool Details page.
- In the Settings tab, under the System Health Thresholds area, enter the new values for the thresholds in the I/O latency thresholds boxes.
- Click Apply.
Pool Depletion Thresholds
The rate of pool resource depletion is monitor over time using disk pool performance counters. The monitor is called the pool depletion monitor. The threshold uses the Estimated Depletion Time counter for pools, which shows the projection to pool depletion at a particular point in time. (In Live Performance, this counter value will be displayed as more than 30 days if the projection exceeds the maximum threshold value of 30 days. The counter will be displayed as N/A if the estimation could not be calculated due to an insufficient amount of data.)
Associated thresholds may be set to notify administrators when depletion is projected for a specific number of days. When the number of days for each threshold is reached, the appropriate level message is generated. By default, warning and critical level thresholds are set to zero, which disables these threshold settings. This tool is helpful to anticipate the need for additional storage requirements in advance.
This threshold differs from the Available Space Thresholds for a pool in that it is based on the estimated time to depletion instead of a allocation percentage level reached. This threshold grants administrators more time to react if the allocation rate is fast and does not alert if there is sufficient space in the pool for the set number of days.
A graphical representation of the projection of storage depletion for a pool can be displayed in the Allocation Estimation tab of the Disk Pool Details page.
Three thresholds can be set:
- Attention level (default setting is 30 days to depletion, which is the maximum threshold value)
- Warning level (default setting is 0 days, which disables the setting)
- Critical level (default setting is 0 days, which disables the setting)
To change the threshold alerts:
- In the DataCore Servers panel, click on the pool to open the Disk Pool Details page.
- In the Settings tab, under the System Health Thresholds area, enter the new values for the thresholds in the Pool depletion thresholds boxes.
- Click Apply.
Physical Disks
An I/O latency threshold can be customized for DataCore disks and physical disks that are in disk pools and used as pass-throughs.
I/O Latency Thresholds
The I/O latency threshold monitors all read and write I/O to a disk and provides alerts when I/O latency reaches the setting for each threshold. When the threshold is exceeded, the appropriate level message is generated. Use the diagnostic tools such as Live Performance, and the Allocation View to troubleshoot the latency issues to determine what resource is causing the I/O transfer to slow down.
Three thresholds can be set:
- Attention alert (default setting is 120 ms- milliseconds)
- Warning alert (default setting is 240 ms)
- Critical alert (default setting is 480 ms)
To change the threshold alerts:
- In the DataCore Servers panel, click on a pool disk or DataCore disk to open the details page.
- In the Settings tab, under the System Health Thresholds area, enter the new values for the thresholds in the I/O latency thresholds boxes.
- Click Apply.
Ports
Busy Count Per Second Thresholds
A System Health monitor counts each time that the a port busy is returned due to a queue full condition. The Total Busy Count / sec counter is monitored. Thresholds can be set for Fibre Channel ports on a DataCore Server to generate a message when the busy port count has reached the threshold set. When a threshold is reached, the appropriate level message will be generated.
Three thresholds can be set:
- Attention alert (default setting is 1 per second)
- Warning alert (default setting is 1,000 per second)
- Critical alert (default setting is 2,000 per second)
To change the threshold alerts:
- In the DataCore Servers panel, click on the port to open the Fibre Channel Port Details page>Settings tab..
- In Advanced Options under System Health Thresholds, enter the values to change for the thresholds in the Busy count per second thresholds boxes.
- Click Apply.
Replication Buffers
Available Space Thresholds
An available space threshold can be set for replication buffers to alert the administrator when available space reaches the percentage set in the threshold tool. Thresholds are set per server. The DataCore Server counter % Free Space for Replication Buffer is monitored. When the available space reaches the percentage set for a threshold, the appropriate level message will be generated.
Three thresholds can be set:
- Attention alert (default setting is 30%)
- Warning alert (default setting is 20%)
- Critical alert (default setting is 10%)
To change the threshold alerts:
- In the DataCore Servers panel, click on the server to open the DataCore Server Details page.
- In the Settings tab, under Advanced Settings, enter the new percentage values for the thresholds in the Replication buffer available space thresholds boxes.
- Click Apply.
Virtual Disks
Virtual disks have five different monitors with custom thresholds settings.
I/O Latency Thresholds
The I/O latency threshold applies to the front-end paths to virtual disks. Latency performance counters report the maximum latency of all the front-end paths. When any one of the front-end paths reach the corresponding threshold, the appropriate level message is generated. Use diagnostic tools such as Live Performance, and the Allocation View to troubleshoot the latency issues to determine what resource is causing the I/O transfer to slow down.
Three thresholds can be set:
- Attention alert (default setting is 30 ms- milliseconds)
- Warning alert (default setting is 60 ms)
- Critical alert (default setting is 120 ms)
To change the threshold alerts:
- In the DataCore Servers panel, click on the virtual disk to open the Virtual Disk Details page.
- In the Settings tab, expand Advanced Options. In the System Health Thresholds area, enter the new values for the thresholds in the I/O latency thresholds boxes.
Click Apply.
Storage Latency Thresholds
The storage latency threshold applies to the back-end paths to the storage used by virtual disks. Latency performance counters (Cache I/O Maximum Time / Operation) for virtual disk storage sources report the maximum latency time per operation during each sample time (by default every two minutes) of all the back-end paths. When the maximum value for any one of the back-end paths reaches the corresponding threshold, the appropriate level message is generated. (Single spikes in latency during the sample time will not cause the threshold to be met; the threshold must be exceeded more than once during the sample time.) Use diagnostic tools such as Live Performance, and the Allocation View to troubleshoot the latency issues to determine what resource is causing the I/O transfer to slow down.
Three thresholds can be set:
- Attention alert (default setting is 120 ms- milliseconds)
- Warning alert (default setting is 240 ms)
- Critical alert (default setting is 480 ms)
To change the threshold alerts for a virtual disk:
- In the DataCore Servers panel, click on the virtual disk to open the Virtual Disk Details page.
- In the Settings tab, expand Advanced Options. In the System Health Thresholds area, enter the new values for the thresholds in the Storage latency thresholds boxes.
- Click Apply.
Minimum Retention Period Warning Threshold for CDP
The history log retention period for a data protected virtual disk is monitored due to normal fluctuations. The minimum retention period warning threshold allows a threshold to be set that will issue a warning if the number of hours left in the history log drops below the threshold. The number of hours available in the history log affect the possible restore times for a rollback.
The threshold is set for a number of hours. For instance, if the threshold is set to 24 hours, you will receive a warning when the amount of data in the history log drops below 24 hours (in other words for 23 hours, 59 minutes, 59 seconds or less). In this example, at the time of the warning, the oldest rollback that can be created will contain data from the last 23 hours, 59 minutes, and 59 seconds.
The threshold will not produce a warning until data protection has been enabled for the length of the threshold setting. This behavior prevents warnings for virtual disks that are recently data protected. In the case of the example above, the monitor will not begin until the virtual disk has been data protected for 24 hours.
The default value is zero. Zero means that the threshold is disabled and will not produce a warning.
To change the threshold alert:
- In the DataCore Servers panel, click on the virtual disk to open the Virtual Disk Details page.
- In the Settings tab, expand Advanced Options. In the Continuous Data Protection area, enter the number of hours for the threshold in the Minimum retention period warning threshold box.
- Click Apply.
Maximum History Log Warning Threshold for CDP
The history log size for a data protected virtual disk is monitored on the data protected storage source. The maximum history log size warning threshold allows a threshold to be set so that when the history log grows to the size set, a warning will be issued. The setting is a percentage of the maximum history log size setting for the data protected virtual disk.
The default setting is 100% of the maximum history log size for the virtual disk. For example, if the maximum history log setting is 8 GB and the attention threshold is set to 120%, an attention alert will be triggered when the current history log size grows to 9.6 GB (8 GB x 120%).
If a log size consistently exceeds the log size that is set, it could indicate that the speed of the data protected storage source is too slow to handle the more rapid destaging of the history log causing the log to exceed the maximum history log size. In this case, the data protected storage source could be moved to a pool with faster disks. (The monitor uses the performance counter % History Log Allocated which is located under the category Pool virtual disk sources for the virtual disk instance.)
To view the actual allocated size of the history log, see the Virtual Disk Details page > Info tab.
To change the threshold alert:
- In the DataCore Servers panel, click on the virtual disk to open the Virtual Disk Details page.
- In the Settings tab, expand Advanced Options. In the Continuous Data Protection area, enter the percentage of the maximum history log size to use as the threshold in the Maximum history log size warning threshold box.
- Click Apply.
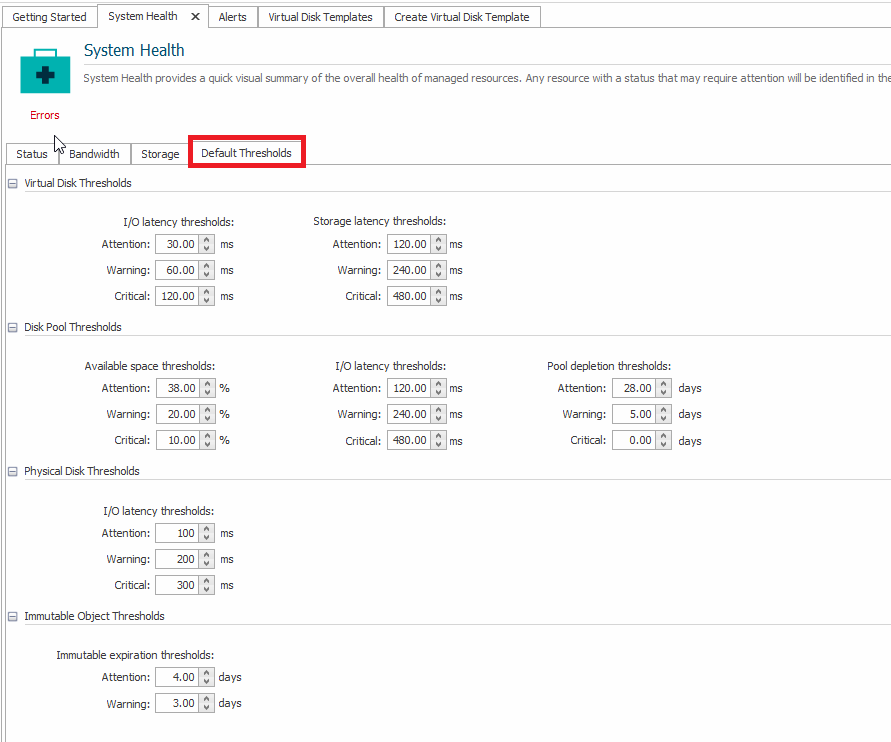
Global Default Thresholds
In addition to customizing thresholds for individual resources, you can now configure Global Default Thresholds in the System Health settings. This feature allows you to maintain threshold values centrally, so they are applied automatically to supported resources. This saves time and ensures consistency, eliminating the need to set thresholds for each resource manually, unless a resource requires special treatment. When any resource reaches its defined threshold, the system sends alerts to notify you, enabling timely action to maintain system health.
Global Default Threshold values are adjustable to the following resources in the DataCore Management Console:
- Virtual Disks
- Disk Pools
- Physical Disks
- Immutable Objects (Virtual disks, Rollbacks, and Snapshots)
For more information on setting thresholds for individual resources such as Virtual Disks, Disk Pools, or Physical Disks, see the respective sections above.
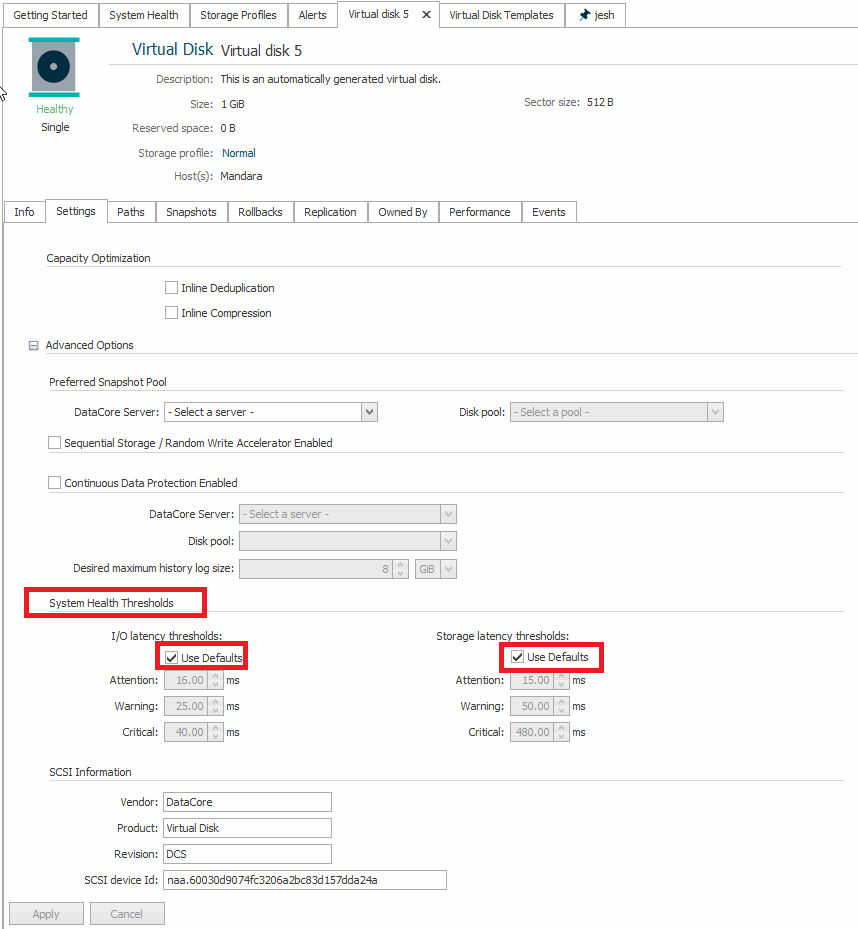
When the Use Defaults checkbox is selected for a resource (such as Virtual Disks, Disk Pools, or Physical Disks) in Settings > System Health Thresholds, the default values defined in System Health > Default Thresholds are automatically reflected in that resource. Any changes made to the global default threshold are also automatically updated in the resource. To override the defaults, clear the “Use Defaults” checkbox, enter custom threshold values, and apply the changes.
Example:
For a Virtual Disk, when the Use Defaults checkbox is checked under System Health Thresholds, the I/O latency and Storage latency thresholds reflect the values of the Virtual Disk Thresholds defined in the Default Thresholds.
Immutable Object Thresholds
When immutability is applied to an object, such as a virtual disk, snapshot, or rollback, a retention expiry is defined. In System Health > Default Thresholds, you can set the Attention and Warning thresholds under Immutable Object Thresholds. These thresholds determine when alerts are generated as an immutable object approaches its retention expiry. For more information about applying immutability, see Creating Immutability for SANsymphony Objects.
The global default thresholds help notify you in advance, allowing you to take any required action before the retention period of immutable objects (virtual disks, snapshots, and rollback virtual disks) expires.
- Attention – Number of days before retention expiry when an attention-level alert is generated.
- Warning – Number of days before retention expiry when a warning-level alert is generated.
These thresholds apply to all immutable objects that use the default threshold settings.
- The retention expiry is defined when a virtual disk, snapshot, or rollback is made immutable.
- The thresholds determine only when alerts are generated; they do not affect the retention expiry.
- Once the retention expiry is reached, the immutable object remains in the immutable state until immutability is explicitly revoked. For more information, see Immutability Revocation.
Setting Global Default Thresholds in System Health
- In the DataCore Management Console, navigate to System Health from the ribbon and select the Default Thresholds tab.
- Define threshold values for each supported resource:
- Virtual Disks: I/O latency and storage latency thresholds
- Disk Pools: Available space, I/O latency, and pool depletion thresholds
- Physical Disks: I/O latency thresholds
- Immutable Objects (Virtual Disks, Snapshots, and Rollbacks): Attention and Warning thresholds for retention expiry alerts.
- Click Apply to save the defaults.
All newly created resources of these types will inherit the default values from the Global Default Thresholds in System Health. For existing resources that were using default values, their thresholds will automatically reflect the new values from the Global Default Thresholds when updated. Resources configured with custom threshold values will remain unchanged when global defaults are updated
Customizing Threshold Values
To customize values for a specific resource (for example, Virtual Disks or Disk Pools):
- Open the resource and go to Settings > System Health Thresholds.
- Clear the Use Defaults checkbox for required threshold.
- Enter your preferred values and click Apply to save the changes.
Global Default Thresholds in Virtual Disk Templates
The global Default Threshold values are also applied to Virtual Disk Templates.
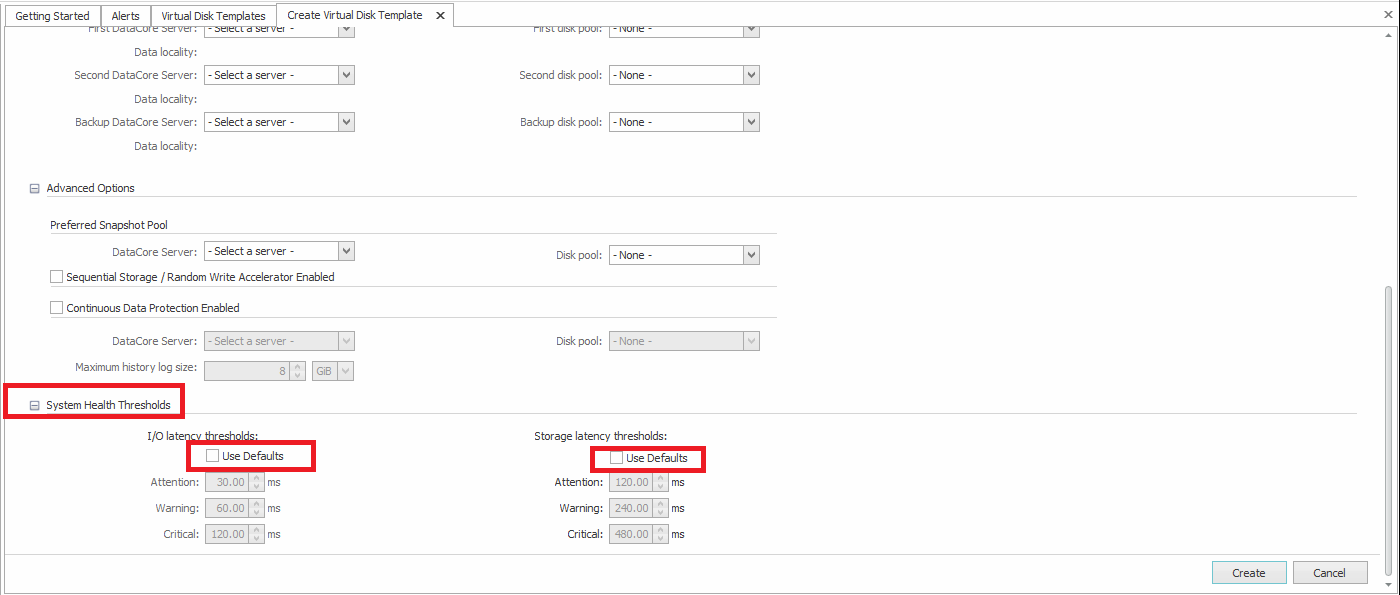
- When creating a new template, selecting the Use Defaults checkbox in Settings > System Health Thresholds applies the Default Threshold values.
- To override these values, clear the Use Defaults checkbox and enter custom thresholds directly in the template.
- If Use Defaults check box is selected in the template, the virtual disks created from that template inherit the Default Threshold values.
- If custom values are defined in the template, the virtual disks created from that template inherit the custom threshold values defined in the template.
- When Use Defaults option is selected in a Virtual Disk Template > System Health Threshold, the template inherits the Virtual Disk Threshold values defined in the global Default Thresholds.
- You can also manage Default Threshold values using DataCore PowerShell cmdlets or the REST API. Refer to the Get-DcsDefaultThreshold and Set-DcsDefaultThreshold cmdlets in the DataCore Cmdlets documentation for more details.
Learn More