Monitoring
Pool metrics exporter
The DataCore Bolt pool metrics exporter runs as a sidecar container within every io-engine pod and exposes pool usage metrics in Prometheus format. These metrics are exposed on port 9502 using an HTTP endpoint /metrics and are refreshed every five minutes.
Supported metrics
| Name | Type | Unit | Description |
|---|---|---|---|
| disk_pool_total_size_bytes | Gauge | Integer | Total size of the pool |
| disk_pool_used_size_bytes | Gauge | Integer | Used size of the pool |
| disk_pool_status | Gauge | Integer | Status of the pool (0, 1, 2, 3) = {"Unknown", "Online", "Degraded", "Faulted"} |
# HELP disk_pool_status bolt name status
# TYPE disk_pool_status gauge
disk_pool_status{node="worker-0",name="bolt-disk-pool"} 1
# HELP disk_pool_total_size_bytes bolt name total size in bytes
# TYPE disk_pool_total_size_bytes gauge
disk_pool_total_size_bytes{node="worker-0",name="bolt-disk-pool"} 5.360320512e+09
# HELP disk_pool_used_size_bytes bolt name used size in bytes
# TYPE disk_pool_used_size_bytes gauge
disk_pool_used_size_bytes{node="worker-0",name="bolt-disk-pool"} 2.147483648e+09
Integrating exporter with Prometheus monitoring stack
-
To install, add the
Prometheus-stackhelm chart and update the repo.Copyhelm repo add prometheus-community https://prometheus-community.github.io/helm-charts
helm repo updateThen, install the Prometheus monitoring stack and set
prometheus.prometheusSpec.serviceMonitorSelectorNilUsesHelmValuestofalse. This enables Prometheus to discover customServiceMonitorfor DataCore Bolt.Copyhelm install [RELEASE_NAME] prometheus-community/kube-prometheus-stack -n <bolt_namespace> --set prometheus.prometheusSpec.serviceMonitorSelectorNilUsesHelmValues=false -
Next, install the
ServiceMonitorresource to select services and specify their underlying endpoint objects.CopyapiVersion: monitoring.coreos.com/v1
kind: ServiceMonitor
metadata:
name: bolt-monitoring
labels:
app: bolt-servicemonitor
spec:
selector:
matchLabels:
app: metrics-exporter-pool
endpoints:
- port: metrics
namespaceSelector:
any: true
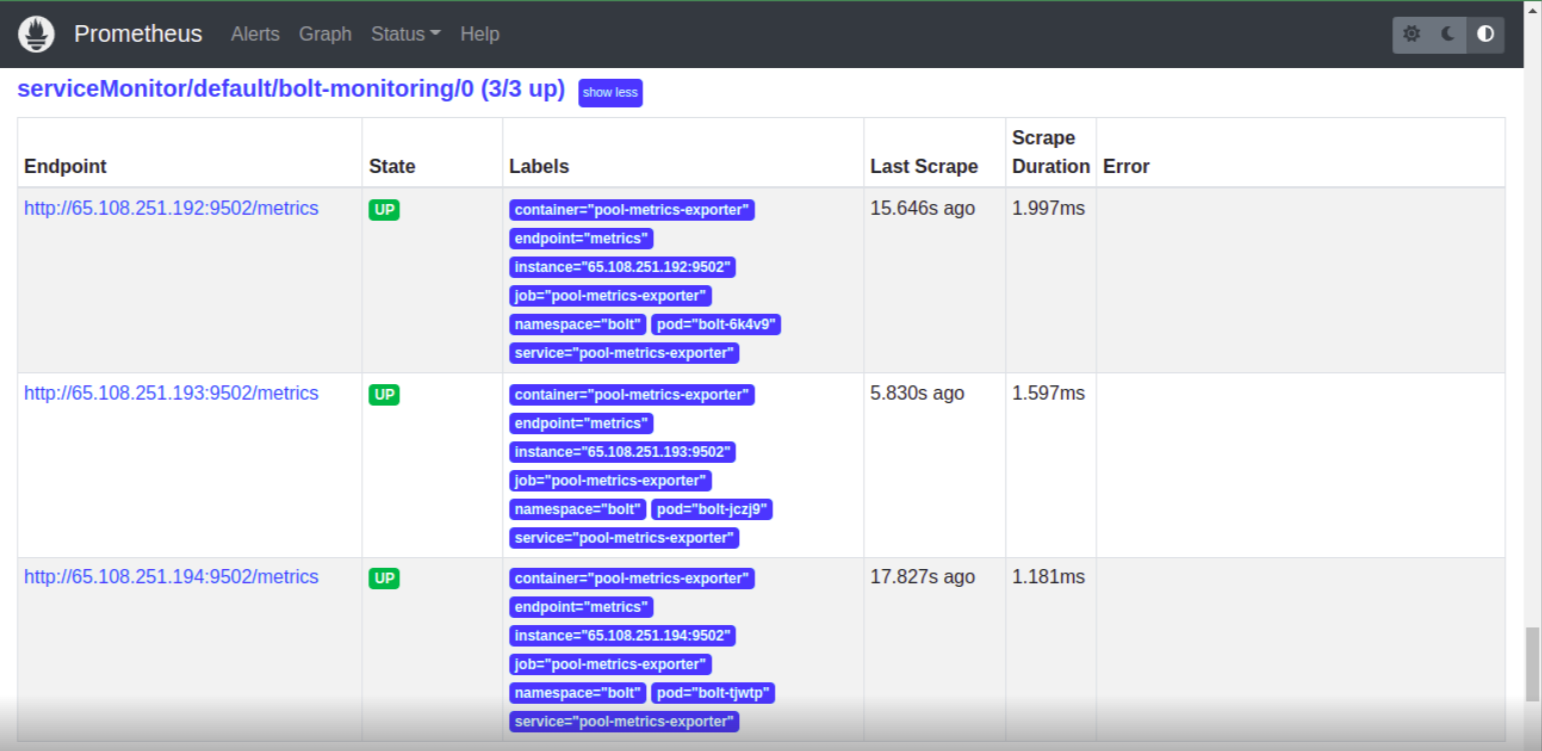
Upon successful integration of the exporter with the Prometheus stack, the metrics will be available on the port 9090 and all the endpoints will be able to make HTTP calls.